Hello Everyone…
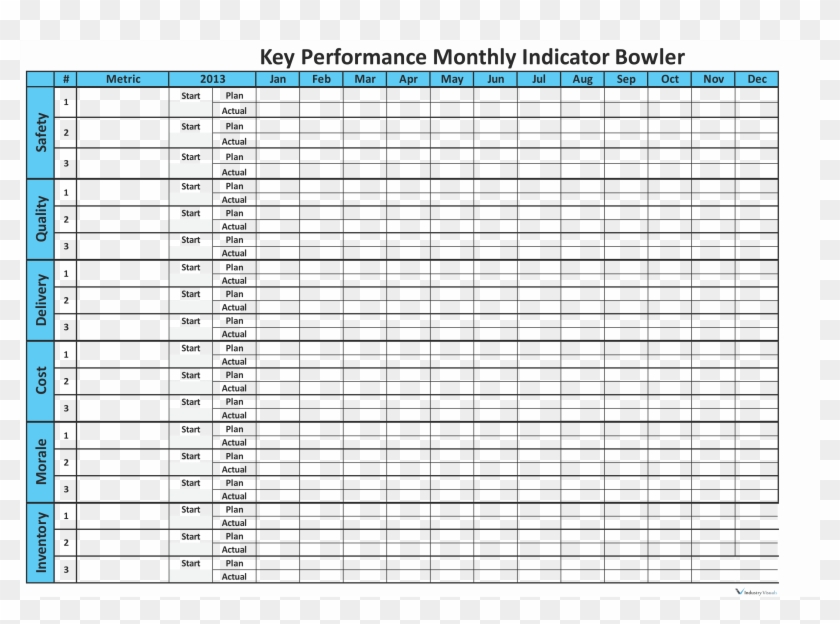
Im starting to develop some apps and websites with Bubble and Im having trouble trying to figure out a way to do a “actual x planned forecast table” like the one below:
The problem is that Im trying to find a way to show de value of each month, but I got no idea how to do that. It seems that repeating groups only work with lines, not columns(to repeat each the values of each months).
Thanks for posting to our forum! To answer your question, you have two options:
The table you’re trying to create is possible to do with the repeating groups. While repeating groups cannot be made for columns, it is possible to create smaller groups within the rows to generate values per column.
Bubble has a built-in plugin called “Excel-like Handson Table” that allows you to create a table format similar to Excel. I’d suggest playing around with that plugin and seeing if you can customize it to your needs.
Give that a try, and let us know if that works for you!