This is a long shot as I don’t really know your data or how your API call responses are structured, so I’m not sure if this will work for you. I’m making some important assumptions as follows. if they are true, then maybe what I’m about to propose might just work.
Assumptions:
-
That your RGs are based on the same API, or more importantly that the data behind them can be sorted uniformly, i.e by the same field. Ideally, they both refer to the same dataset.
-
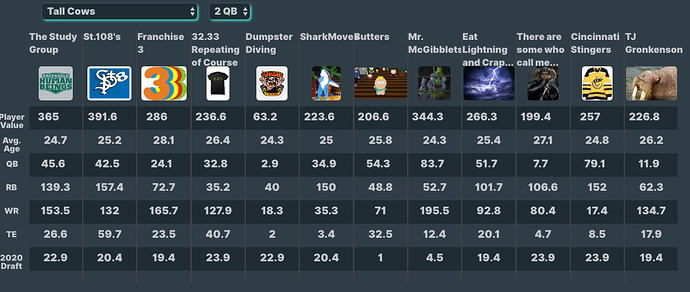
That if you were storing the data in a table in your database, it would look something like this:
Player ¦ Position ¦ Score
St 108’s ¦QB ¦45.6
St 108’s ¦RB ¦139.3
St 108’s ¦WR ¦153.5
St 108’s ¦TE ¦26.6
Franch 3 ¦QB ¦42.5
Franch 3 ¦RB ¦157.4
Etc
At any rate, try putting the following in an html element, replacing the searches with your API calls. I think you need to ensure that your data from the calls (assuming you’re actually making multiple calls) are sorted by the same field so that row 1 in the first search relates to row 1 in the second search and so on.
<html>
<head>
<!--Load the AJAX API-->
    <script type="text/javascript" src="https://www.gstatic.com/charts/loader.js"></script>
    <script type="text/javascript">
  // Create and populate the data table.
google.charts.load('current', {'packages':['corechart', 'table']});
google.charts.setOnLoadCallback(drawVisualization);
function drawVisualization() {

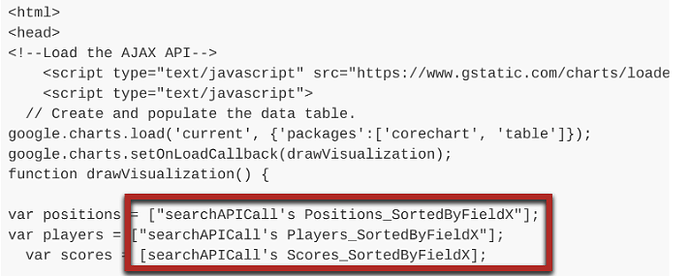
var positions = ["searchAPICall's Positions_SortedByFieldX"];
var players = ["searchAPICall's Players_SortedByFieldX"];
  var scores = [searchAPICall's Scores_SortedByFieldX];

var data = new google.visualization.DataTable();
  data.addColumn('string', 'Player');
  data.addColumn('string', 'Position');
  data.addColumn('number', 'Score');

  for(i = 0; i < players.length; i++)
    data.addRow([players[i], positions[i], scores[i]]);

var distinctValues = data.getDistinctValues(1);

  var viewColumns = [0, 1];
    var groupColumns = [];
    // build column arrays for the view and grouping
    for (var i = 0; i < distinctValues.length; i++) {
        viewColumns.push({
            type: 'number',
            label: distinctValues[i],
            calc: (function (x) {
                return function (dt, row) {
                    return (dt.getValue(row, 1) == x) ? dt.getValue(row, i) : 0;
                }
            })(distinctValues[i])
        });
        groupColumns.push({
            column: i+2,
            type: 'number',
            //label: distinctValues[i],
            aggregation: google.visualization.data.sum
        });
    }

	data.sort({column: 0, desc: false},{column: 1, desc: false});
     var view = new google.visualization.DataView(data);
    view.setColumns(viewColumns);

    // next, we group the view on column A, which gets us the pivoted data
    var pivotedData = google.visualization.data.group(view, [0], groupColumns);

    // draw agg table
    new google.visualization.ChartWrapper({
      chartType: 'Table',
      containerId: 'table-div',
      dataTable: pivotedData
    }).draw();

        var options = {
          vAxis: {title: 'Scores (totals)'},
          hAxis: {title: 'Players', maxTextLines: 3},
          seriesType: 'bars',
          legend: {position: 'top', maxLines: 1, alignment:'center'},
          isStacked: 'false'
        };

  // Create and draw the visualization.
 new google.visualization.ComboChart(document.getElementById('curve_chart')).
    draw(pivotedData, options);

      };
    </script>
  </head>
  <body>
    <div id="curve_chart" style="width: 600px; height: 400px" align="center"></div>
<div id="table-div" style="width: 600px; left: 100px" align="center"></div>
  </body>
</html>
Update: Just had a thought, rather than making your api calls a second time in the html, you could just use RG1’s list of results and RG2’s list of results.


