
I am trying to plot data that my api connector returns using the Chart plugin, but have datatype issues. I don’t clearly understand how data is being handled.
Step 1:
This is the JSON my API connector receives:
{
“Data”:[18,18,18,0,29,29,29,30,29,35,35,23,24,7],
“Time”:[0,5,10,15,20,25,30,35,40,45,50,55,60,65]
}
During initialization of the this call, bubble recognizes both fields as lists and I set the datatypes to be “number” .
Step 2:
All I want to do is plot these against each other(MyApiCall’s Data against MyApiCall’s Time) using the Chart plugin element. But I couldn’t figure out how.
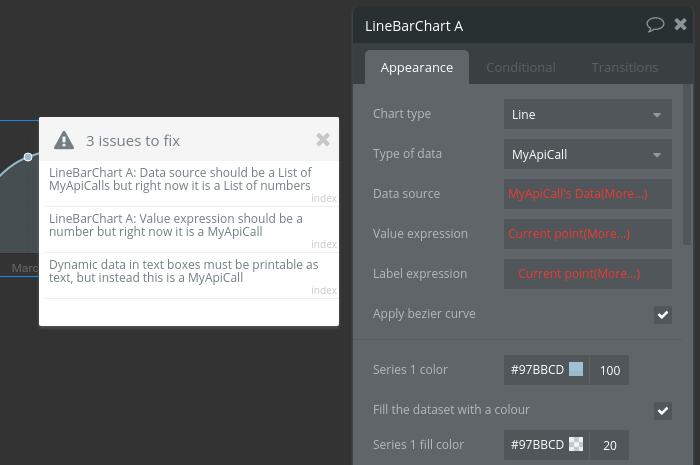
What should the data source be? All the options get in the dropdown box are ‘User’ and ‘MyApiCall’. Shouldn’t there be an option for numbers?