
@aestela — makes sense, thanks for the additional feedback. Adding this to my todo list for the week as well. Will make an announcement when these features are ready!
I am not sure yet. Probably need a world map and maybe certain countries.
1 Like
Ok @mufei401 – keep me posted once you know which maps you need and I will take a closer look. Let me know if you need anything else!
1 Like
Update v4.10.0: Mixed Bar/Line Charts auto-tooltips now support before/after units for Y Axis B
The auto-tooltips generated by Mixed Bar/Line Charts now show the before/after tooltips you set for the second Y Axis (Y Axis “B”) @aestela thanks for the request!
Also, @aestela – for your other request:
Leaving it auto is giving me troubles when there are many elements, for example. If my graph has 15 columns, only 10 labels are shown. If I could override it and force the labels to be printed in a -45º or -90º angle would solve this.
I realized that there might already be a solution for you. Try adjusting the “Max X Ticks” setting to a higher number (e.g. 15 or greater for 15 columns in your example) – let me know if that helps! Here’s a screenshot of that setting in the properties menu:

Let me know if you have any feedback!
Alex
Great!! changing the Max Ticks worked like a charm!! Thanks a ton!
@aestela you got it – as always, don’t hesitate to let me know if you have any other feedback!
Alex
TechBlocks
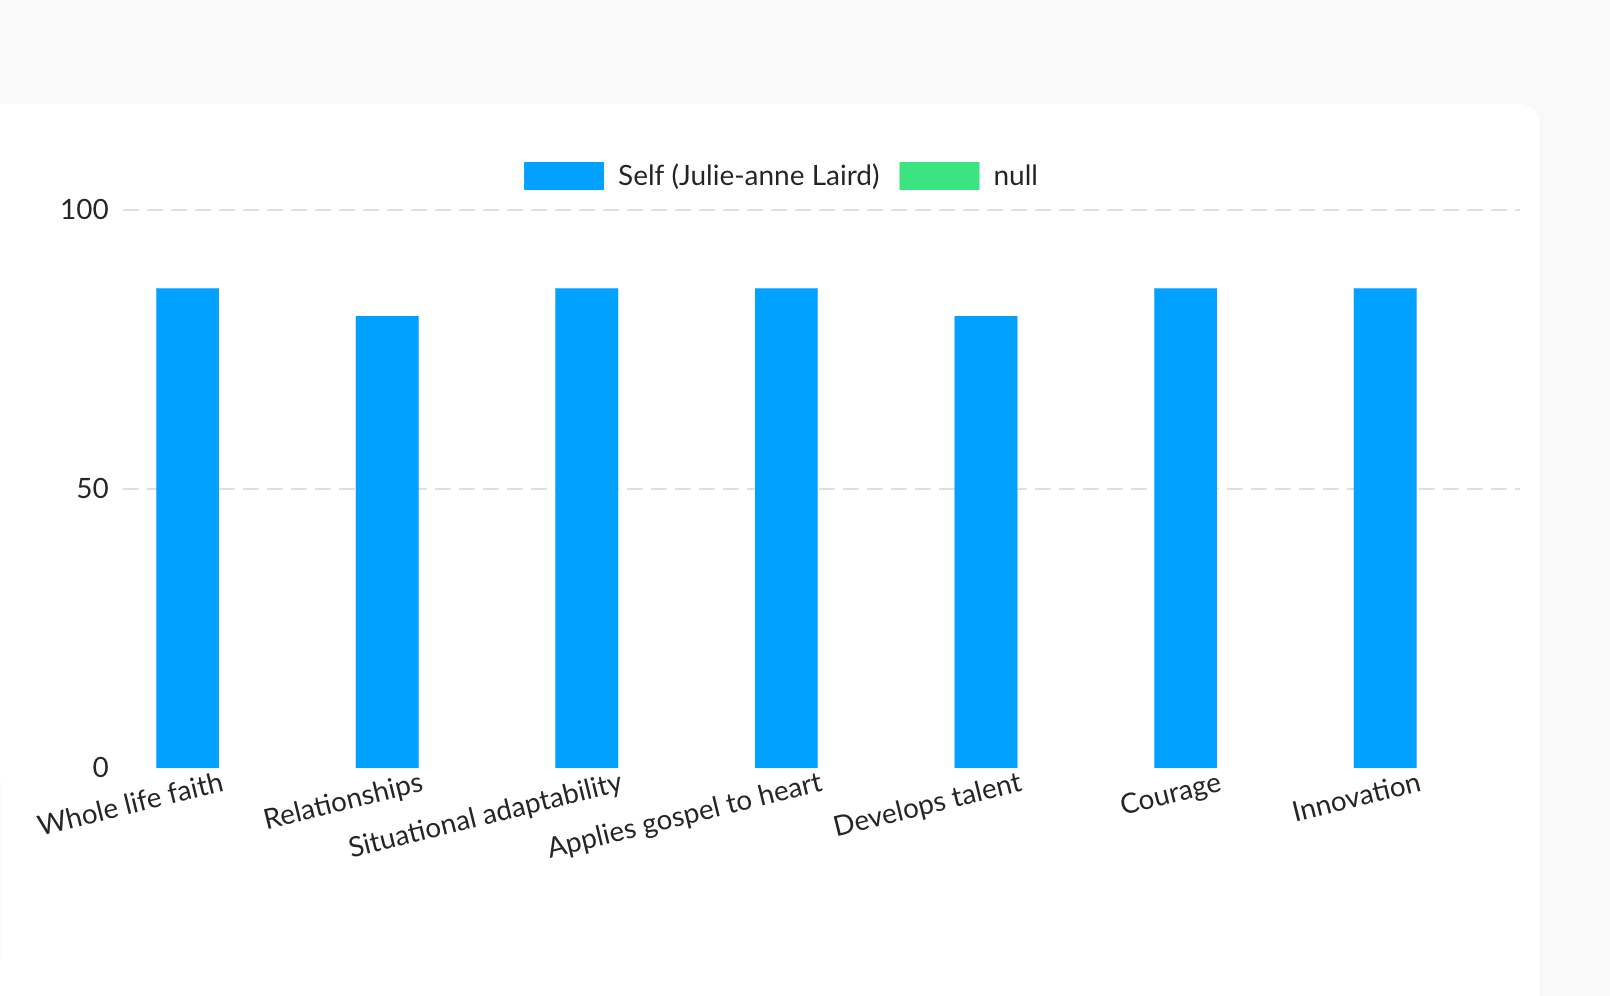
Hi, I’m using this plugin and getting a null value on the last series in the dataset.
Im dynamically populating datasets so I don’t know how many there will be. Do you know what could be causing this? It only shows null for the last empty dataset, all other empty datsets do not display.
Thank you
Hey @felicity.evans thanks for reaching out!
Could you DM me a link to your editor so I can take a look at your implementation? I’m not sure what’s going on from your description and screenshot and would like to take a closer look.
Alex
Hi @alex4 , been using this a while and thanks for the great plugin.
My app is getting a little heavy and so I’ve been running page load speed tests, and your plugin it seems adds a “render-blocking resource” to pages:
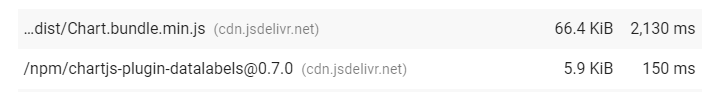
I admit I only have a superficial understanding of what this means and what can be done so please correct me if I’m wrong, but is it possible to add this required library via an element to only the pages that have charts on them?
Thank you.
Hey @mihira – thanks for reaching out and great to hear you’ve been liking the plugin!
Absolutely, I can take a look into moving the library to the element level instead of the plugin level so that the libraries are only loaded on pages. Keep you posted on how it goes.
Best,
Alex
1 Like
Great news! Thank you so much.
1 Like
Hi all – just pushed a fix in v4.10.2+ that requires each data series on a Bar/Line and Mixed Chart to have both a data series name and a list of values in order for it to populate on the chart. This should fix edge cases where a “null” value shows up when only the series name or the data is populated for these chart types.
@felicity.evans thanks for the feedback – let me know if you notice any issues!
Thank you. Works for me. I really appreciate you fixing this so quickly.
You got it – happy to hear it’s working well for you! Let me know if you have any other input. I’m more than happy to take a look
Update v4.11.0: Bar/Line and Mixed Charts: Added the ability to customize line chart point’s background and border colors
Hi all, just pushed a new update enabling you to specify line/area chart point background/border colors. Previously, the line/area chart’s points were defaulted to the point background = the series color and the point border = white. I’ve released an update that will allow more customization for these options if you add the series via workflow action. Hopefully this will allow you to more precisely achieve the look you’re going for. Let me know if you have any question!
Hi Alex, Need some support here, How can I add filters to my data? I have a dropdown with months and based on a selected month, I would like to update the cart (Y values). Moreover my X values in the database should be unique elements + a filter to exclude one variable. Can you please help with this? (in the bubble charts this works flawlessly)
Hi @peer — thanks for reaching out!
Sure, I can try to help you set up your dynamic expression. Can you please DM me a link to your editor with a page that isolates the search expression/chart you want to create?
Hi @alex4, I just wanted to let you know that I noticed your update ![]()
![]()
But then when I proceeded to check the libraries loaded on a page without chart elements I still get these loaded when comparing to when the plugin is uninstalled:
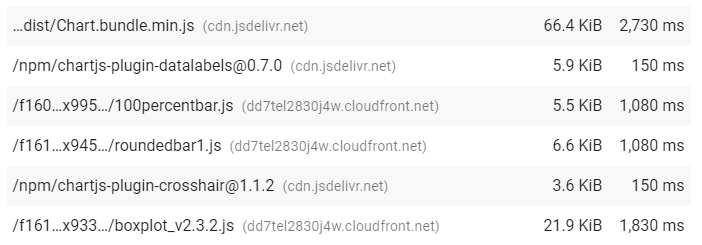
I’m a little confused, wouldn’t that update have removed these?
@mihira – hmm that’s strange. I was going to to a bit more testing before making an announcement here on the forum but it should be working. Let me take a closer look. Thanks for letting me know!
2 Likes
Hi @alex4 , i’m thinking about getting this plugin for the trendline scatter chart. Can you elaborate on how it works or point me in the right direction? I don’t see the “documentation” tab in the link. Thanks!