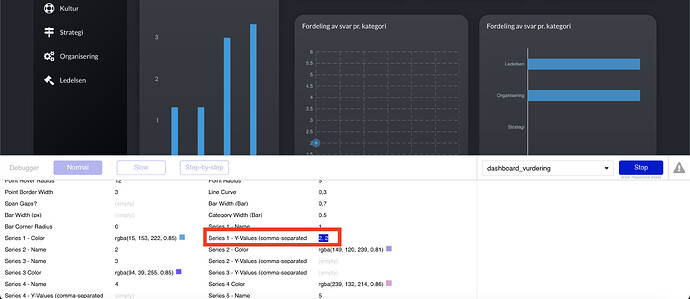
I’m using Chart.js to display graphs. Some of the searches return no values. That should be stated as 0 but now it’s empty. I’ve added 0s in the editor. When I do that it all works perfectly. Is there a way to add 0s where the results returns empty? I’ve attached the group by as well.
use when condition “is empty”:format as text
Since it it boolean the format as text will give you a “yes/no” format option. For “yes” but 0 for “no” put the value from the group by
Hello @bubble.trouble .
Thanks so much for reaching out and for the great suggestion. This sounds like the perfect solution, but it did not give the wanted result. I still get no zeroes. Maye I did something wrong?
for the 0 you shouldn’t need a comma after it unless I’m confused about something.
Also, I don’t think you need the search again in the formatting as no. You should be able to access the field from something like “This Grouping’s” sum
Thanks so much for reaching out again. I really appreciate the help.
I tried both 0, and just 0. Same result. “This grouping’s” is not an option when I try to perform the search.
If you have the time you can always have a look in the editor. This is the link: Tinkrtoolslms | Bubble Editor.
You’ll find the element in “Gruppe undersøkelser” → “Liste med templates_standard” → “Group Spørreundersøkelser” → “Group Spørreundersøkelser” → “Group Spørreundersøkelser” → “Group verdi” → “Bar/line chart value”
A bit of a language barrier looking at the editor (although that is definitely helpful in reviewing the issues, so much appreciated).
What I was referring to is “each item’s sum” (see below). Most of the times in a chart when grouping you want the aggregate value not the other group option. The other group option would potentially be used on the other axis (in this case the x-axis). After you get the sum value then you want to add the format as text condition after that.
One additional tip when building charts. When I’m building charts, most of the time I spit out the data onto the page as a text field. So I will dump the y values (comma separated) into a text field on the page. And then dump the x values (comma separated) into a text field on the page. I will debug the query this way until I get the proper data set and then just copy/paste the expression into my chart x/y inputs as the last step.
If the above suggestion doesn’t work and you can’t manage to get it working and you need more help, create these test/debug fields so I can see the output on the page.
A workaround I found to this, is using “:floor” or “:ceiling” on your aggregation, which turns an empty grouping into 0 (which first of all requires having enabled “Do not skip empty groups” on the grouping).
Obviously only makes sense to do this if your aggregates are always integers, as you would otherwise alter your data.
If anyone knows of a better way to go about this, I’d be happy to know.


