
hello the community ,
I need your help , I 'm trying to start with charts , but I’m missing something I think .
My database is as follow :
Order
with field : Date de commande , Commane ID , Amount
I want to build a chart representing : The number of order each day and the total amount each day .
I’m not able to do it each time I have the following line bar chart

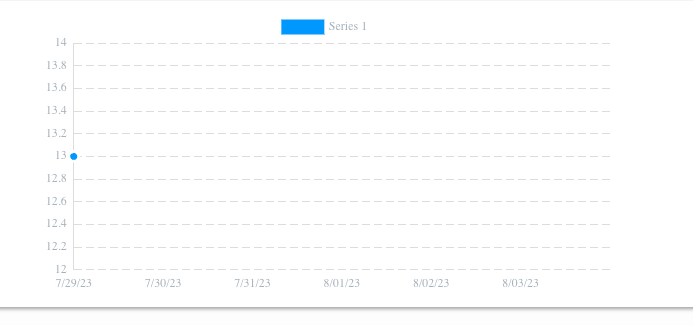
Thank you for your kind help