We’re excited to share that the new real-time workload reporting is live! You can now visit the workload charts in the App Metrics tab of your apps to immediately view and access workload data in real time. The updated bar chart also provides 1-minute granularity for the last 24 hours. Check out our interactive walk-through to learn more.
As you explore real-time reporting, you’ll also see some other updates that we recently released to improve visibility into workload consumption:
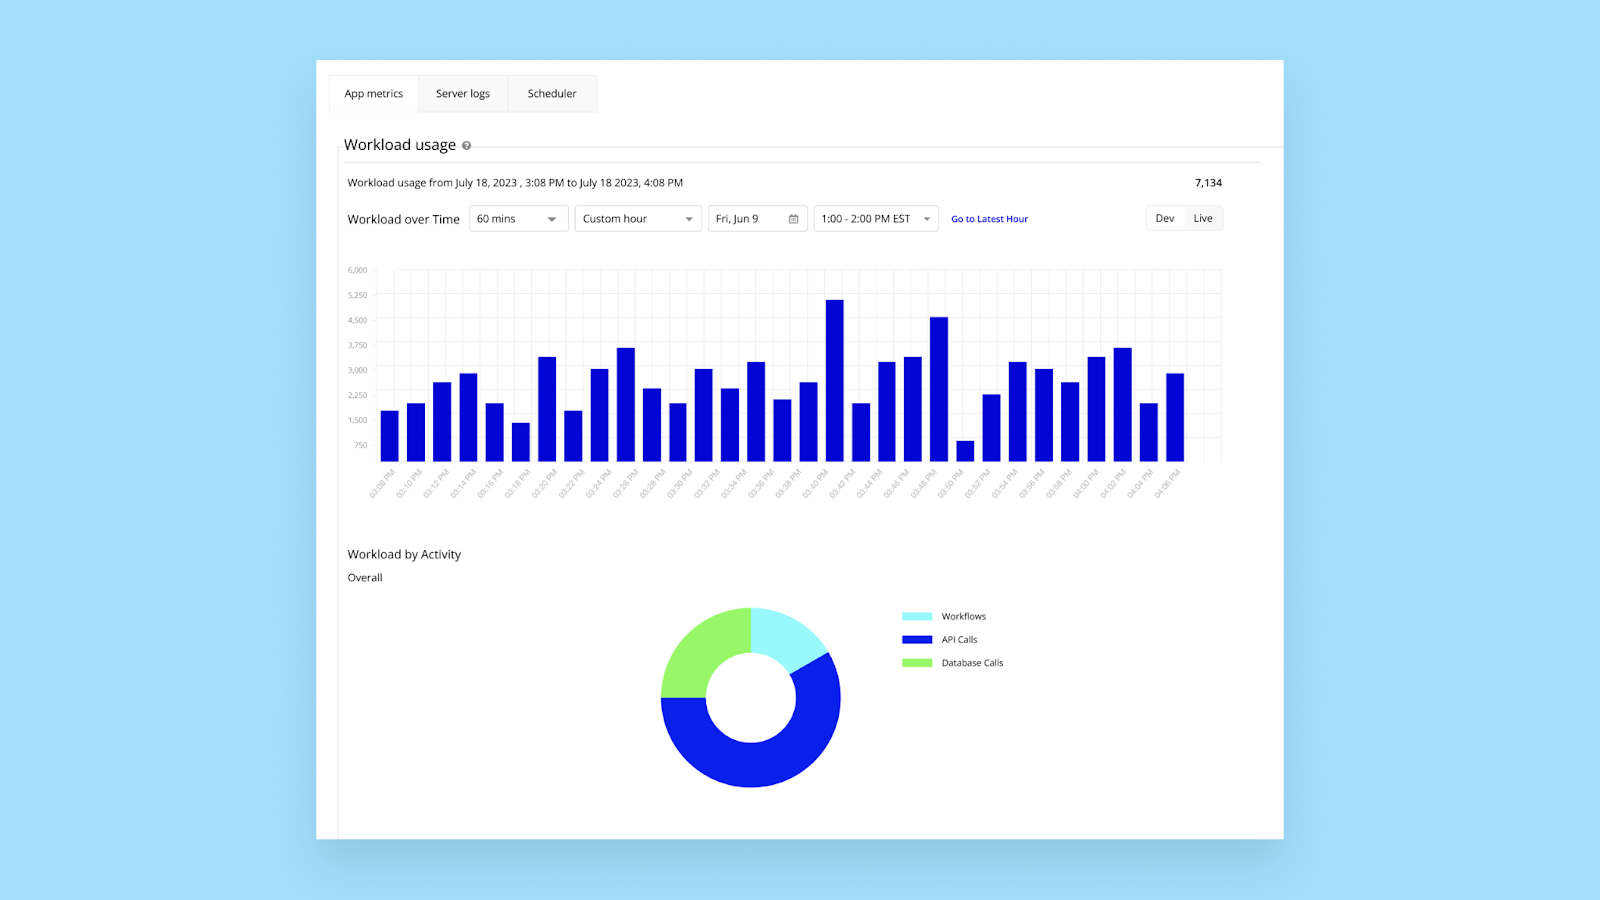
Get a more granular view of activities consuming workload units (WUs) with enhanced drill-down capabilities in the pie chart:
Drill down and navigate to the exact action in a workflow.
Drill down and navigate to the API workflow that is being called by an external application or system.
Drill down and navigate to the data type that is being read by an external application or system via your app’s Data API.
See the number of WUs charged for each workflow action and the total for each workflow run in the Server Logs tab.
See the number of WUs consumed alongside the percentage in the workload pie chart.
Workload tooling has been — and continues to be — a top priority for us. We’re excited to hear how you’re liking the new real-time reporting and any feedback you have. Thanks so much, and happy Bubbling!
it seems that we’re now being charged WU consumption for looking at data on the data tab in the app editor.
(I consumed 530 WU in a couple of minutes just by looking at the data tab in the editor for one particular data-heavy app)…
This seems to be true in ALL my apps.
The manual says this shouldn’t be the case (or does ‘importing’ data include simply loading it in the data tab?):
Does using the editor consume workload?
The only activity in the editor that uses workload is running bulk operations and importing/exporting data in the Data tab. Otherwise, interacting with the editor does not contribute to workload usage.
Has this changed? (are we now consuming WU just by looking at data in the data tab?)
Or is the reporting (and therefore the billing) incorrect?
The manual is correct in that it should not be the case. Looking at data in the data tab should not consume workload. Interacting with the editor, outside of bulk operations and importing/exporting data, does not contribute to workload.
If this is reporting differently in your editor logs, could you please submit a bug report and our team would be happy to look into it for you.
Would be nice if it displayed the last WU use, average WU use and largest/smallest on a Workflow, rather than having to dive into the janky logs sections.
I guess this helps for transparency. Had a quick look, an API request sending raw text is costing me 6 workload units, a postmark transactional email is costing me 5.
These numbers are still nuts compared to the actual compute involved.
One thing I feel is lacking is getting the logs into URL parameters (or similar), so a refresh on the editor will leave the logs right where they’re at.
I can confirm I am definitely seeing this on my editor logs as well. I specifically didn’t touch anything else, but I scrolled through one of my data types with around 1000 lines, reloading the editor several times, and hit 16WU in a single minute for '‘Individual Data Request’
I kind of expected that this would cost WUs, but yes it does seem against what they have mentioned.
If they are going to charge for it (while probably they shouldn’t), least they should do is not show the table content by default when we go to app-data and click on any data type or switch from one to another etc.
I do a fair amount of debugging on our live data and having to pay for each of those unwanted searches getting triggered won’t be nice.
We really appreciate you flagging this so we could get it fixed quickly. If you ever see something that doesn’t look right, you can always file a bug report, and we’re also here to respond on the forum. Thanks!
All the time I file bug reports for items which I think are bug and I get the reply that it is intended behaviour.
For this time around it felt to me that it is intended behaviour from your side (i.e. The moment we go to the data type in app-data tab, the data is shown by default), you are asking me to file a bug report
It seems like a design choice to me and a design choice that can be improved if it is going to result into costing us extra.
@adamhholmes maybe you can file a bug report for what you noticed (i.e. WU being charged for app-data tab while it shouldn’t be charged as per documentation)