Hi everyone! ![]()
I’ve just released a new plugin for Bubble:
3D-Scatter Chart
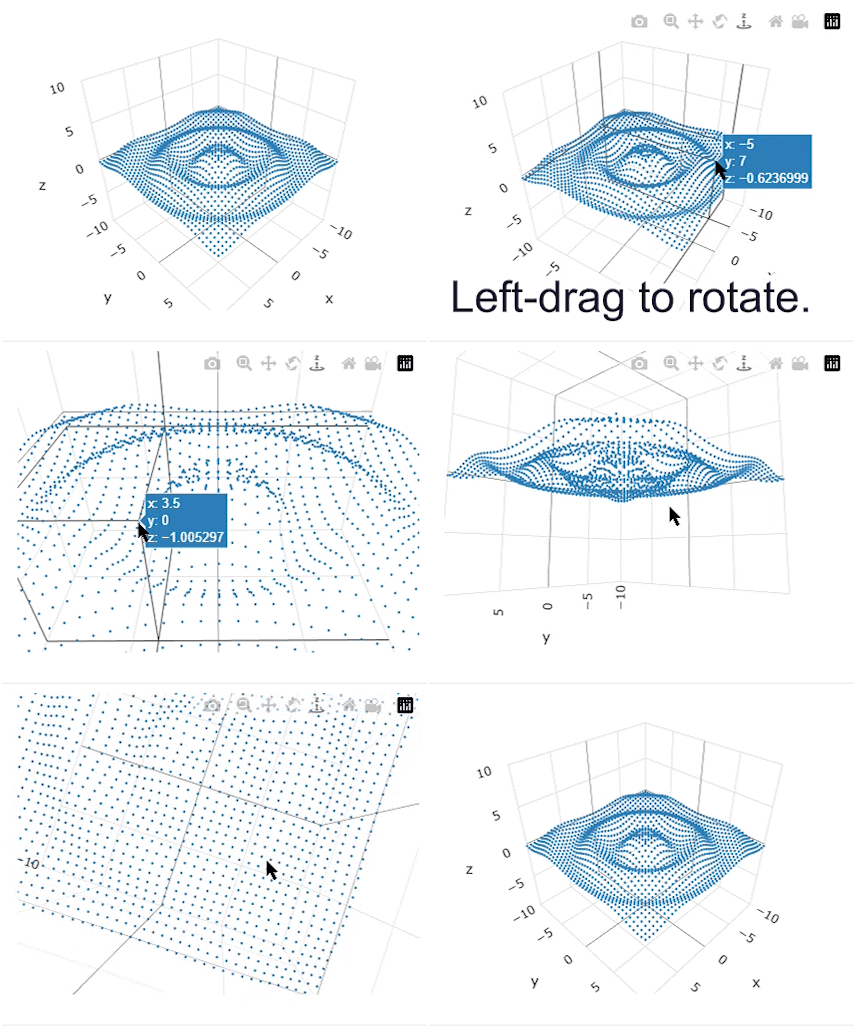
This plugin allows you to visualize 3D scatter plots directly in your Bubble app.
Perfect for apps that need to display point cloud or 3D coordinate data.
 Features
- Easy to use – just drag & drop and configure properties
- Fully interactive – rotate, zoom, and move the chart
- Hover to see point coordinates
- Save the chart as an image (PNG)

 Live Demo
 Documentation
Feel free to check it out and let me know your feedback or questions!
Screenshots and suggestions are always welcome.
