[PLUGIN] - Google Maps Geometry/Drawing + W3W

I see how that’s the google functionality and it makes sense. It would work best for me if a marker image could stay the same geographical size like shapes do. Or even if its no longer a “marker” but an image placed on the map. I googled around and saw a few people trying to accomplish the same not sure their outcome.

Not being visible after a certain zoom level would work well, I think google does this with points on interest on maps.google.com

Next update is here… v1.27.0

@justinnnnnn, @renwagner

New States

  • Current zoom
    • Contains the current map zoom level.
  • Map style
    • Contains the current map style name.
  • KML file
    • This contains the KML file generated from a shape.

New Events

  • Zoom has changed
    • Fires when the zoom level of the map is changed.
  • Map style has changed
    • Fires when the map style has changed.
  • KML file has been generated
    • Fires when a KML file has been generated.
  • Drag has started
    • Fires when either a marker or shape has started a drag across the map.
  • Drag has ended
    • Fires when either a marker or shape has ended a drag across the map.
  • Polyline has been resized
    • Fires when a polyline has been resized.
  • Rectangle has been resized
    • Fires when a rectangle has been resized.
  • Circle has been resized
    • Fires when a circle has been resized.
  • Polygon has been resized
    • Fires when a polygon has been resized.

New Actions

  • Set zoom
    • Allows you to set the zoom level.
  • Map style
    • Allows you to change the map style.
  • Select shape
    • Allows you to select a shape via it’s Id.
  • Generate KML file
    • Allows you to generate a KML file.

Changes to actions

The actions ‘Set marker’ and ‘Set list of markers’ both contain the following new options…

image


The actions ‘Draw shape’, ‘Enable drawing tools’ and ‘Select drawing mode’ contain the following new option…

image

The Select drawing mode has had a lot more controls added to it, much of the same which you see within the other actions.

Additional info

Previously, shapes were only selected when clicked upon, they’ll now also be selected when a drag starts (when the shape is dragged on the map).

The map zoom level option had to be removed from the ‘Set list of markers’ action because it was causing some issues. If you relied on this, just use the Set zoom action afterwards.

Marker and shape states have been added to the clear states action.

Still on my list of things to do…

text within a shape, it could be limited to the size but options to try and include are center, top, bottom, left, right and think about rotation
(undecided if I’m doing this yet)

look at adding database dropdown controls directly into the map element, which allow to select a table full of markers/shapes that dynamically change on the map as the data changes

create an action to add a ‘list of shapes’
(similar to that of adding a list of markers)

rotation for rectangles & polylines
(bit tricky with rectangles because the object doesn’t support setting/getting of coordinates for the four vertices involved, may need to convert to polygon first and then rotate, but then it won’t be a rectangle anymore)

ability to add symbols, they should be capable of attaching to markers and shapes and have all options included

look into custom map overlays, data layer and heatmaps

Paul

Hey hope you’re enjoying your weekend, amazing work as usual. I’m loving the new options. After going through things I have a few notes and tweaks below when you have time to get to them.

Fixes

  • When a shape or marker is dragged the shape is selected visually but the id states are not updated.
    • Can we have the ID of the dragged shape? Right now we can’t tell if its a shape or marker.
    • Possibly clear the other state so only 1 ID is selected at a time.
  • When a shape is selected, then a marker is clicked the visual selection remains.
  • Clear states doesn’t visually deselect the shape.
  • When a marker is drawn, marker ID isn’t available early enough to save in database.

Minor Tweaks

  • When a resize happens can we have the ID passed to the action or set the shape ID on resize start so its available when completed.
    • Additionally select a shape visually when resize starts.
  • Option to automatically display marker info window in “Set Marker”.
  • Add Select Marker by id.
  • Action to close marker window by ID.
  • Action to close all marker windows.
  • Ability to change a shapes settings without a redraw (Draggable & Editable) (style settings optional too if possible)
    • This combined with the double click can make items locked and unlocked dynamically (e.g. when selected, or when double clicked)
    • Style settings would enable states or events in bubble to do a lot.
  • Add event “Shape or marker double clicked” and set as selected.
  • In “Enable Drawing Tools” have the options to hide additional google map UI. (full screen, zoom, tilt, style, streetview)
  • When a polygon is drawn the fill colour has transparency and when done using “draw shape” its fully opaque. (when colour is given dynamically)
    • Can we have an option to dynamically set the alpha for colours?
      **This would add tons of settings to the already huge amount, so just an idea if you’re finding the list is getting too large for simple users. There could be a boolean “Advanced drawing settings” in the plugin settings and that would toggle showing all the more advanced drawing features in the editor. I wouldn’t mind either way since I would have advanced set to “on” anyways. Just an idea.

Nice list of things there Justin, I’m half way through them so will do the full write up as normal once they’re all done (or as many as I can do!)

You’re the best! The power of this plugin is unbelievable. :ok_hand:

Haha nice to hear! cheers! I’m just adding all the UI controls into the main map element at the moment so you can set all those UI controls (enabling/disabling etc).

There’s so much that I can think of adding, and I think over time I’ll get as many as I can included, although I gotta say… with all these things you’ve sent us over you’ve helped us a lot too so thank you!

This one here…

When a polygon is drawn the fill colour has transparency and when done using “draw shape” its fully opaque. (when colour is given dynamically)

How are you storing the color? are you using another plugin to do it? like the Color picker by any chance? I can’t seem to replicate it but you do need to be using HEX colors and not the RGB format.

Part of the 6 digit make up of HEX is transparency whilst the RGB transparency part is on the end. The style color settings for shapes require HEX which is bubble’s default.

There are occasions when I need to convert them and I have a function to do that (either way) so I might be able to detect and convert where necessary.

Let us know when you can.

Hey,

My apologies! I am using HEX however, I wasn’t saving the number on the end causing that error.

Sorry!

Next few updates completed v1.28.0

New States

  • GeoJSON
    • Is populated with the shape(s) GeoJSON data when the ‘Get GeoJSON’ action runs.

New Actions

  • Get GeoJSON
    • Populates the GeoJSON state with data from shapes, also supports shape styling properties. The action only deals with shapes.

  • Close info window
    • Allows you to close an info window for a marker using it’s Id.

  • Set map controls
    • Allows you to modify the map UI controls dynamically.

New Events

  • Shape is clicked
    • Fires when a shape is clicked.

  • Shape is double clicked
    • Fires when a shape is double clicked.

Modifications

  • ‘Select shape’ action has been renamed to ‘Select marker/shape’.
  • ‘Change shape colors’ action has been renamed to ‘Change shape properties’.
  • ‘Generate KML file’ action now accepts geojson data from the GeoJSON state.
  • The ‘Select on add’ option in the map element options has had its documentation updated.
  • The ‘Update state’ option in the ‘Draw shape’ action has had its documentation updated.
  • The ‘Enable drawing tools’ action has an additional option called ‘Keep last selection’.
  • Additional UI control options have been added to the map element.
  • When markers are clicked, they now deselect any selected shapes.
  • Clearing states should now visually deselect shapes.
  • Marker Id’s now available earlier than they were before (on dragstart).

Side note

I found a bug which caused for multiple events to trigger when multiple shapes were on the map and a drag operation was in progress. I’ve fixed this but to do required a large chunk of code to be rewritten (more so moving around) but I have rechecked everything and all looks good.

Let us know how things go with all of these.

Hi,

I’ve had to add some controls to help limit the number of requests being made to W3W since right now, when markers are added to the map, clicked, dragged and sometimes hovered, a request is made to your W3W account to update the word address based upon the marker coordinates. The 3M grid display also uses the gridAPI every time the bounds of the map are changed when the zoom level was greater than 17.

This has the potential to cause a lot of requests to be made and it’s certainly not my intention to chew through anyone’s free conversion minutes per month!

With that being said, and after a few emails from the W3W team, the following changes have been put in place.

In the map element, you’ll find these 3 options sitting at the bottom.

Each option controls a state which holds any updated word address. I’ve put the details in the documentation part.

In addition to this, you’ll also see this where you can now select the zoom level at which you want to display the 3M square grid at.

image

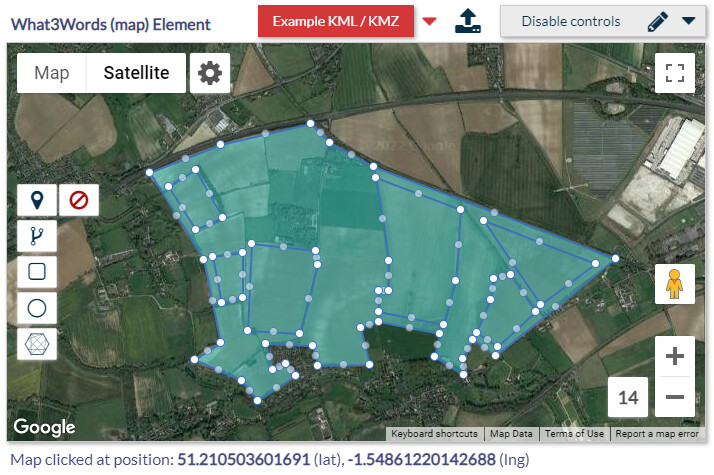
As extra functionality, it’s now possible to use a shape to select a number of markers. I know someone asked about this (sorry I forget who!) but if you set this option within the Drawing tools action to Yes…

image

Then by drawing a shape over a set of markers, will populate the latitude/longitude/Ids states mentioned in the documentation part with all the relevant details which you can then save or do what you want with. The states values will be replaced every time a new selection is made when markers are found within the boundaries of that particular shape.

On the map, when you draw a shape round some markers, you’ll see this icon appear in the bottom left hand corner of the map which shows the coordinates.

I’ve tested as much as I can and all seems to be well, but let me know if you spot anything not quite right.

Paul

1 Like

Update v1.37.0

Symbols are now supported. You can attach a symbol to either a marker or a polyline. The relevant settings for symbols are within the various actions, like Set marker and Draw shape (and a few other places). All styling properties are configurable and they can be made to be not visible at certain zoom levels.

There’s a new action to control the adding of a symbols and another new action which allows you to draw shapes by measurements. So, you can now draw a rectangle or a circle by supplying the width, height or radius values rather than dragging it out on the map or using the saved coordinates. Units of measurement are meters, feet, miles and kilometers.

There’s been a few bug fixes along the way and for anyone using the plugin, I apologise for any inconsistencies. The last few weeks have had a lot of significant changes put in and some of those changes required some re-writing so I’m hoping no one has any issues now.

Paul

2 Likes

Another bunch of updates completed and are as follows…

@court
Two new additions have been added into the dynamic marker options, these are ‘Select marker icon’ and ‘Info window auto close’ which match those of the standard Bubble map element. The descriptions for each of these are shown below.

When a shape is drawn over markers, the 2 states called “Contains latitudes” and “Contains Longitudes” get updated. There is a third state now added called “Contains marker Ids” which I’ve edited this previous post with the details.

@renwagner
The Get GeoJSON and Generate KML file actions have both been amended so that when a KML file is created from passing in a GeoJSON file, it will now contains markers along with any shapes. Previously, you could only generate the shapes. Both types of files can be downloaded and used within other applications. The generated KML file can be loaded back onto the map if needed using the Add KML data action or you can load into Google Earth as mentioned before.

If I’ve missed anything, please let us know.
Paul

@pork1977gm - is it possible to draw on my own custom maps (PDF or JPG files uploaded to the app)?

Hi @DoubleBubble,

How do you mean? Do you mean something like this? Custom overlay’s

Custom Overlays | Maps JavaScript API | Google Developers

If so, then that’s not available at the moment but I can add that feature.

Paul

Hi @pork1977gm, I’m more interested in drawing polygons rather than actual map functionality. So I mean to use the drawing functionality on a custom image not necessarily linked to Google maps (for example, an detailed image of a computer motherboard)

Afraid that’s impossible to do. You have to have the map in order to draw any shapes. You could however have the map and a custom overlay which lies over the entire map (your motherboard image). The image would make the map not viewable so it may work. I’ll try that on the demo page and see if it works.

hi @DoubleBubble

Take a look at the demo page now and in the top left corner is a red button called “Create Image Overlay”.

I’ve created an action which allows for an image to be placed on top of the map. After that I placed a few shapes using coordinates at specific places on the map to highlight certain components.

It’s not ideal but if you’re still looking for a solution then this may suffice. The what 3 words side of things can be disabled so you don’t need to worry about that if you only wanted the map functionality.

The “image overlay” action comes with a few options so you can restrict the zoom out and panning for example, and only allow the zoom in which also zooms the shapes in proportionally to the image. The shape colors and transparency are all fully configurable.

If you do use this, you’ll want to make sure the map is placed into the same position every time it loads so the image and shapes are always together (since to draw a shape, you use lat/lng values) and the zoom level is at a constant value so that any shapes drawn and not larger/smaller than they should be.

I’ve pushed the update anyway since image overlays were on my list of things to add.

Paul

1 Like

Hi @pork1977gm
Wow, that looks great! And is it possible to zoom in into the image?
I assume that placing the image and the map into the same position during the load can be done automatically, is it correct?

Yep that’s correct, you can zoom in and both the image and polygon’s are zoomed together. You can’t zoom out beyond the image itself though, although that is configurable to a degree, and yep you can place the image automatically. Actions to set the zoom level, position (using coords) and image overlay are all a series of actions.

An update to include 3 new actions has finally arrived! These actions are to do with manipulating polygons and creating complex polygons. They’ve taken some considerable time to complete but I’m really pleased they’re finally in, tested and working.

Thanks to @justinnnnnn for the help!

Just to show what can potentially be done with these, here’s a few images.


These are against the Map element.

  • Cut shape
    This action cuts a hole into a shape which is the outline of another shape and can either fill that area with a new polygon or subtract it from the main shape entirely. Any shapes passed into this action are converted to polygons first (polylines not supported). You must provide an outer shape and at least 1 inner shape. The output is a complex polygon.
    -Add or subtract
    Values for this option can be either add or subtract. When using a value of 'subtract' any cut holes using the inner shape Id's will be removed from the main shape. When using a value of 'add' the cut hole will be filled with a new shape that can then be moved around independently.
    -Fill hole
    When set to Yes, any inner cut sections (holes) will also be filled. Note: If you run this action a second time using the new polygon which already has cut out sections, then this selection will be maintained for any further cuts.
    -Shape Id (outer)
    Enter the shape Id of the outer shape. This is the main shape which you'll be adding or subtracting from.
    -Shape Id (inner 1) and -Shape Id (inner 2) and -Shape Id (inner 3)
    Enter the shape Id of an inner shape. This is the shape which should be inside the outer shape.
    -Shape Id’s (inner list)
    You can supply a list of shape Id's to be used for the inner shape. You can use this in conjunction with the other singular inner shape Id fields above, or use instead of. This will be handy if you plan on cutting lots of holes into a shape.
    -Use styling from
    You can specify the styling that is taken from one of the shapes here. This will be used for the returned polygon. Enter the shape Id that you want to copy the styling from. Leaving this value blank will default to the outer polygon configuration.
    -Measure length
    When set to Yes, will populate the corresponding 'Measured length' exposed state with a value in the specified units.
    -Measure area
    When set to Yes, will populate the corresponding 'Measured area' exposed state with a value in square meters.
    -Units
    Select the unit to measure the length calculations in.
    -Get center
    When set to Yes, will populate the 'Center coordinates' states with latitude and longitude values.

  • Merge shape
    This action will merge overlapping shapes into a new one. Any shapes passed into this action are converted to polygons first (polylines not supported). It takes the outline of all touching shapes to form a new polygon. You can either target all shapes on the map or you can supply a list of shape Id’s.
    -Shape Id’s
    Supply a list of shape Id's that are overlapping. You can leave this field blank and all shapes on a map will be targeted instead.
    -Remove shapes
    When set to Yes, after the shapes have been merged into a new polygon, this will remove the previous shapes from the map.
    -Use styling from
    You can specify the styling that is taken from one of the shapes here. This will be used when the new polygon is created on the map. Enter the shape Id that you want to copy the styling from. Leaving this value blank will default to the first shape put onto the map.
    -Measure length
    When set to Yes, will populate the corresponding 'Measured length' exposed state with a value in the specified units. This will be the perimeter of the outer shape.
    -Measure area
    When set to Yes, will populate the corresponding 'Measured area' exposed state with a value in square meters. Any inner shapes will be subtracted from the total area to give only the shaded area value.
    -Units
    Select the unit to measure the length calculations in.
    -Get center
    When set to Yes, will populate the 'Center coordinates' states with latitude and longitude values.

  • Split shape
    This action allows you to have a polyline drawn through a shape and then split into two. Each side of the polyline will become a new polygon. Note: If the polyline intersects through points which would generate more than 2 polygons, then only 2 will be returned. This action doesn’t support anymore than that.
    -Shape Id
    Enter the shape Id for which you want to split.
    -Polyline Id
    Enter the shape Id that is for the drawn polyline through the main shape.
    -Selected side
    After the shape has been split, you can have either the left or right side automatically selected. Leave this field empty to have neither side selected. Accepted values are: left and right.
    -Retain shapes
    When set to Yes and a shape contains one or more cut shapes (holes), these will be retained after the shape has been split. Setting this option to No will remove any inner sections.
    -Measure length
    When set to Yes, will populate the corresponding 'Measured length' exposed state with a value in the specified units.
    -Measure area
    When set to Yes, will populate the corresponding 'Measured area' exposed state with a value in square meters.
    -Units
    Select the unit to measure the length calculations in.
    -Get center
    When set to Yes, will populate the 'Center coordinates' states with latitude and longitude values.

Paul

3 Likes