Any chance you could add a state and/or event to let me know when the chart element is setup and ready?
I was having an issue where I would try to run add data workflows too quickly on page load and the chart would display nothing.
Any chance you could add a state and/or event to let me know when the chart element is setup and ready?
I was having an issue where I would try to run add data workflows too quickly on page load and the chart would display nothing.
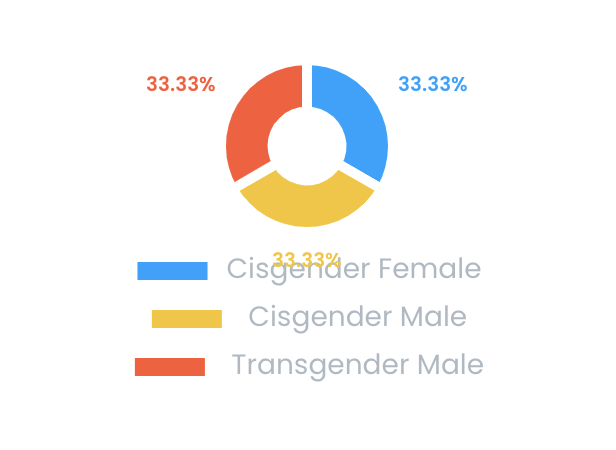
Can someone send an example of their appearance settings for a pie chart that has a legend? I can’t get the legend to not overlap with the label, and a way to format the legend fonts, etc would be great
@bubbler123 Font type and size is inherited by the font in the element.
Regarding the legend, I’m not in the computer right now but you can play with the chart padding setting (not the elements padding) in order to avoid the legend to overlap the labels
Please help, I am reworking this chart today. Issue posted May 12th.
Hello @rico.trevisan ,
Could you share a link with your editor so we can take a look? Make
sure to add alex@techblocksco.com as a collaborator or temporarily set
the permission to “Everyone can Edit”. I will try to check and solve
the issue and will give you an update afterward,
Hello @mc3digital , Apologies for the late response, The team is actually looking into the issues you brought to our attention including this one. This may take some while but I will give you an update within the day for any possible solution.
Hello,
Can I use those analytics to let my customers plug their data (BANK, Stripe, Paypal) and let them analyse it ?
thank you
Hi there!
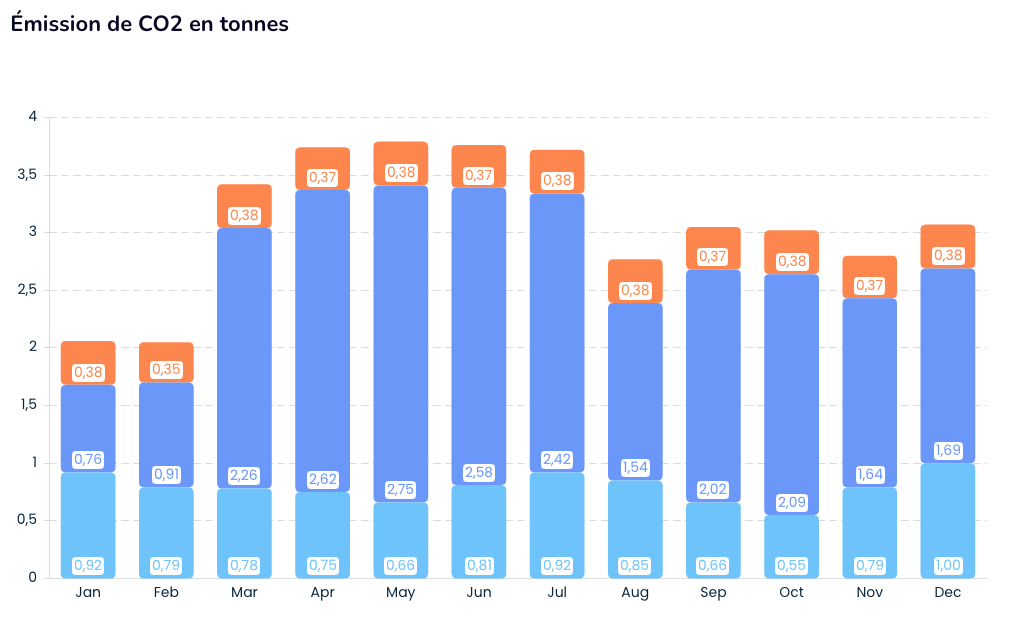
I have a stacked bar in my app. I want the bar to have rounded corners but when i select it, all the the different bar get the rounded corner. However, I just want the last one at the very top to have rounded corner and the rest of them to be flat for aesthetic reasons. Can this be done?
Hello @riverogonzalez.isaac ,
We currently don’t have a feature that allows you to change other bars by clicking a single bar. As for the top rounded bars, I recommend using a bar chart if you want that specific design.
Hi, I purchased the chart js pulugin. But when i try to create any chart on my Mac machine , it works normally on windows machine. it seems to be browser issue as on Mac it worked only on Safari, but not on Chrome, Edge , or Mozila. I tried to clear the cache anc cookies, but it still gives me the below error
The plugin Chart JS - 24 Charts and Graphs / element Chart - Bar/Line/Area threw the following error: ReferenceError: Chart is not defined
at eval (PLUGIN_1553183744528x903111989944909800/Chart-JS—24-Charts-and-Graphs-update–Chart—Bar/Line/Area-.js:5:5)
The same error appears even in the plugin demo app as illustrted in the screen shot.
It was working normally on the subscription plan but when i uninstalled it and bought it and re installed i keep receiving this error. Please help.
Best Regards
Ali Roshdy
After massive research i figured out it is browser related on Mac as on Mac it works normally only on Safari, all other browsers has the same problem. On windows no issue. I think it is related to something called chart.bundle.min.js
Please help me solve this issue on Chrome Mac.
Hi, I’m having trouble displaying data from API on different devices.
The data is shown correctly on my MacBook. However, when I view the data on my iPhone, the values are incorrect. I’m experiencing the same problem on my PC as well.
Macbook:
Iphone:

I have tried displaying the data using the workflow action ‘Add/Update a Data Series Chart-Bar/Line/Area A’ and I used a repeating group to populate the series. Unfortunately, I’m still getting the same result. When I use a repeating group, the data is correct until I add it to the chart.
Still hoping to see padding added to the bubble charts to prevent the clipping of images at the edge of the chart. Similar to how the other charts are setup.
Can this be done this week? Please!
@mc3digital Yes, we’re on this request. We will let you know when this is ready this week!
Hey @mc3digital — we’ve just pushed an update in v4.39.11 that addresses your request. Bubble Charts now have an option to customize Chart Padding under the general properties!
Does that work for your use case?
Please take a look and let me know if you have any feedback!
The chart looks much better now. Thank you!!
How can I force the chart to display 9 segments of equal (square) proportions?
Goal is to divide the segments between the S/M/L sections on each of the chart.
Similar to a tic-tac-toe board…
I have the max ticks set to 4 for the x/y axis in the settings. However, what I would need to do here is set the min ticks to 4 as well. In this example, there is only 3 ticks on each axis being displayed.
The goal is to divide the segments between the S/M/L sections on each of the chart. I drew in the lines roughly to approximate what I am trying to do (didn’t get them to scale but I think the idea is there)
@alex4 any update on resolving this issue. I am still can’t see charts on Edge. and it is not working on Windows machine also?
Thanks for this. I ended up using a different option, but I appreciate the input, in case I come back across it. -K
Hi @ali.roshdy, thank you for patiently waiting for our response. We tried replicating the issue by testing on our end using a Mac device and it was just working properly on our end. Please see the recording for your reference. https://bituin-my.sharepoint.com/:v:/g/personal/jonathan_gamboa_mvp_dev/EcwUTsAnjhVHsksK5v2F4E4Bm-9lOqN3y76llkFzOvbmUg?e=bQv7nw
It was working on safari even on Chrome, Edge and Mozilla.
I’m not sure if it depends on the Device model, but this is the model device we used to test.
Model :
Macbook Pro, 13 inch, M2
MacOS Ventura 13.4.1 (22F82)
Hello Damian, as of our testing for this issue. i tried using an api "https://www.thesportsdb.com/api/v1/json/3/all_leagues.php" to make api call to test about the issue. the result is accurate in macbook and iphone. We will try to replicate the issue, and to do this we want to further check what causes the issue. Could you share a link with your editor so we can take a look? Make sure to add alex@techblocksco.com as a collaborator or temporarily set
the permission to “Everyone can Edit”. We will try to check and solve the issue and will give you an update afterward.
Thanks,