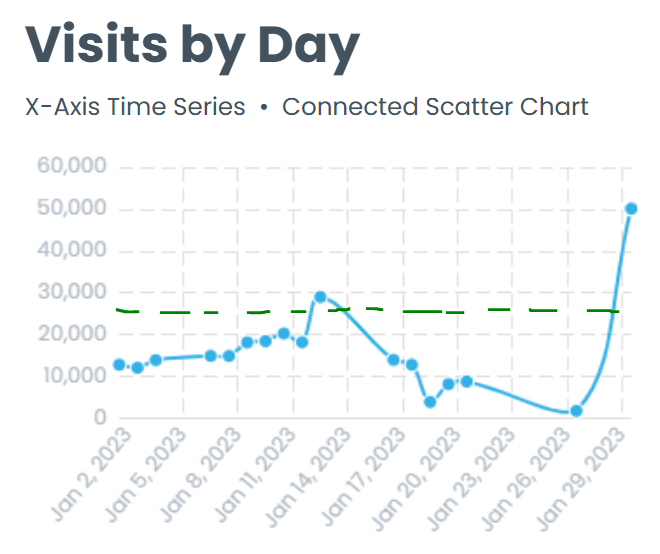
From what I can see, this plugin should do just about everything we need, but I’m not seeing an option for an annotation line on the Y axis of the connected scatter charts. Is this an option? @help6
Screengrab from their Demo site
From what I can see, this plugin should do just about everything we need, but I’m not seeing an option for an annotation line on the Y axis of the connected scatter charts. Is this an option? @help6
Screengrab from their Demo site
This topic was automatically closed after 70 days. New replies are no longer allowed.