This plugin helps you visualize data beautifully in your mobile app using native-rendered charts. Whether you’re showing trends, progress, or comparisons — this plugin gives you an easy way to do it using familiar Bubble inputs.
![]() Available Charts (so far)
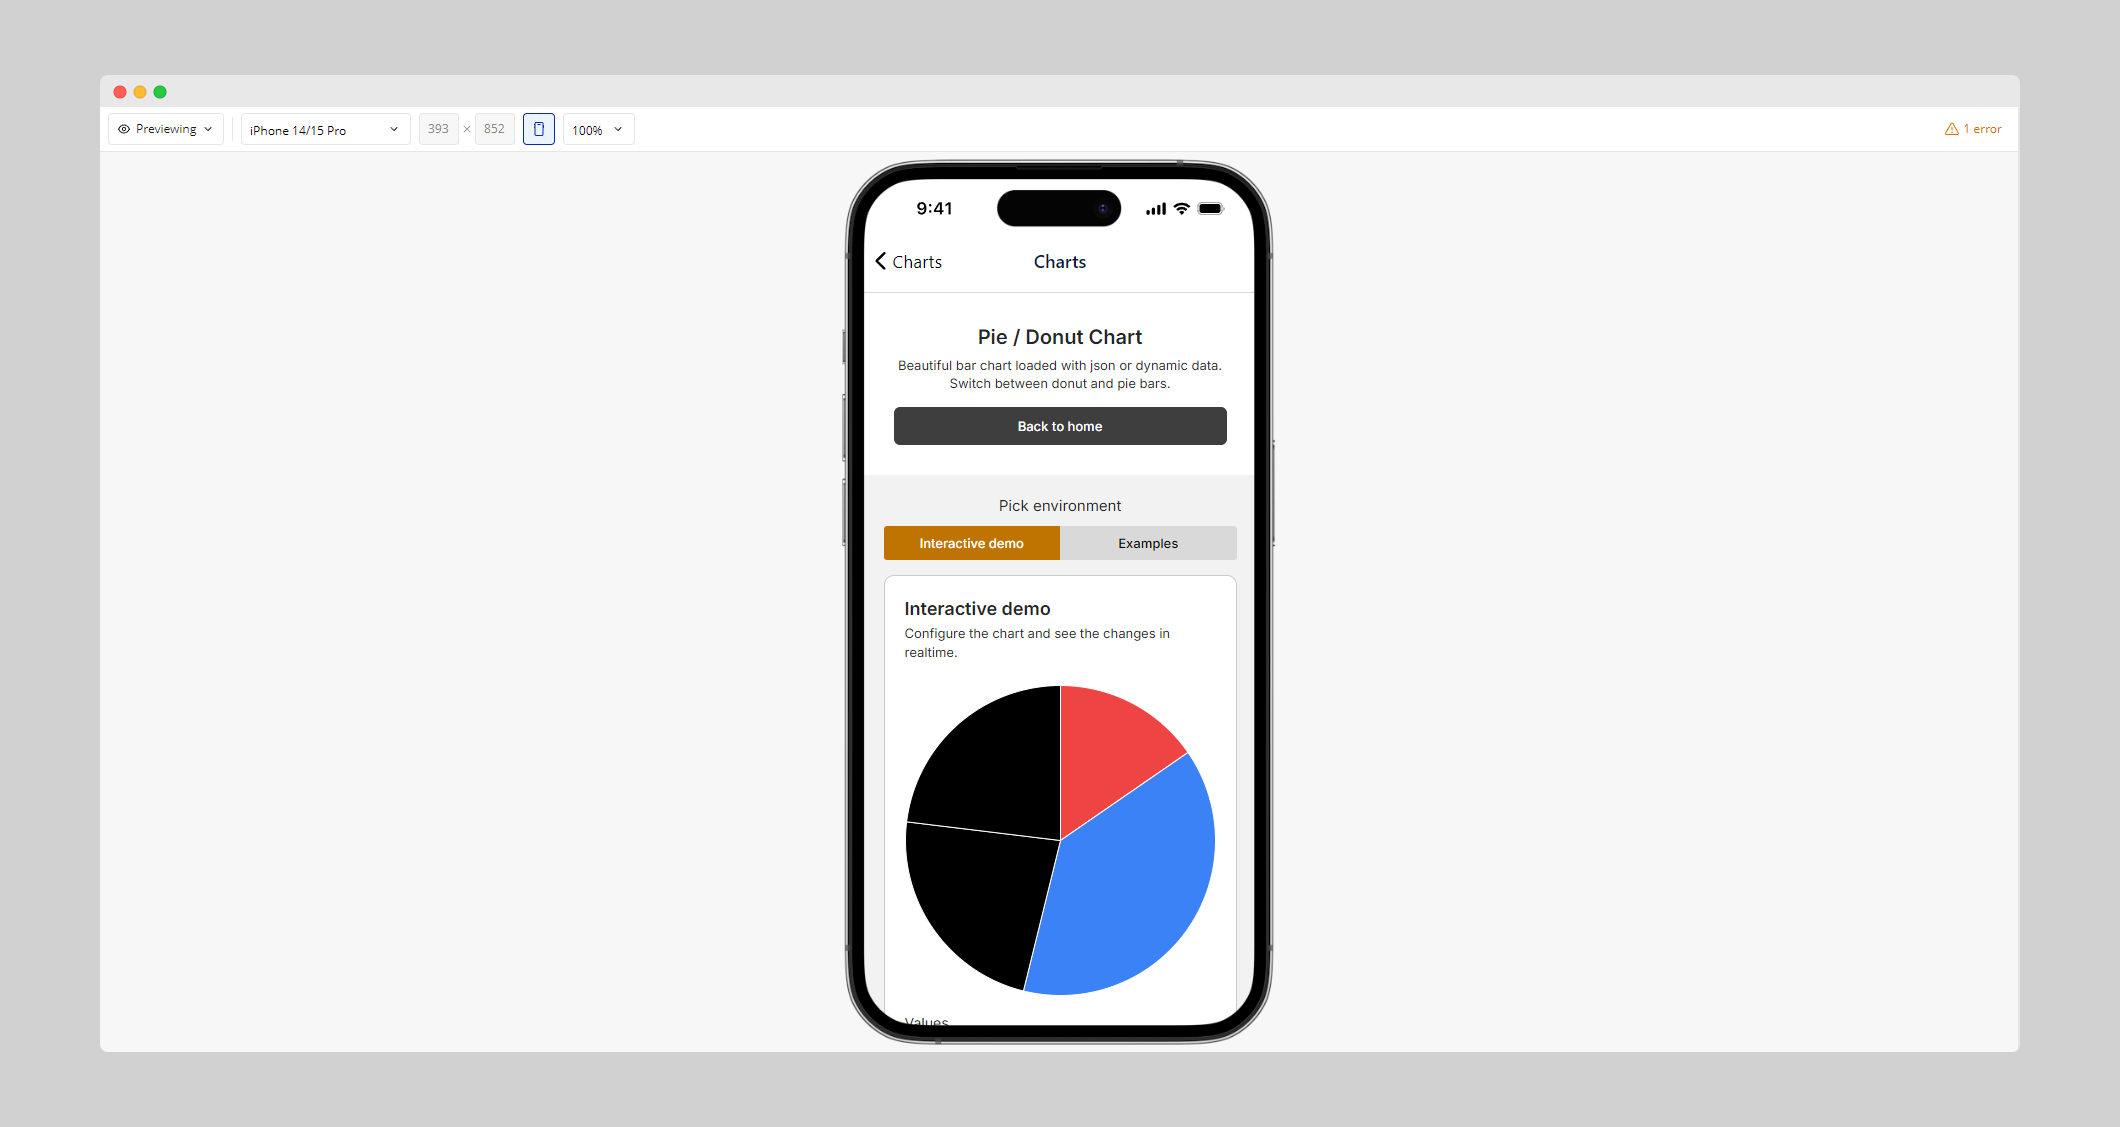
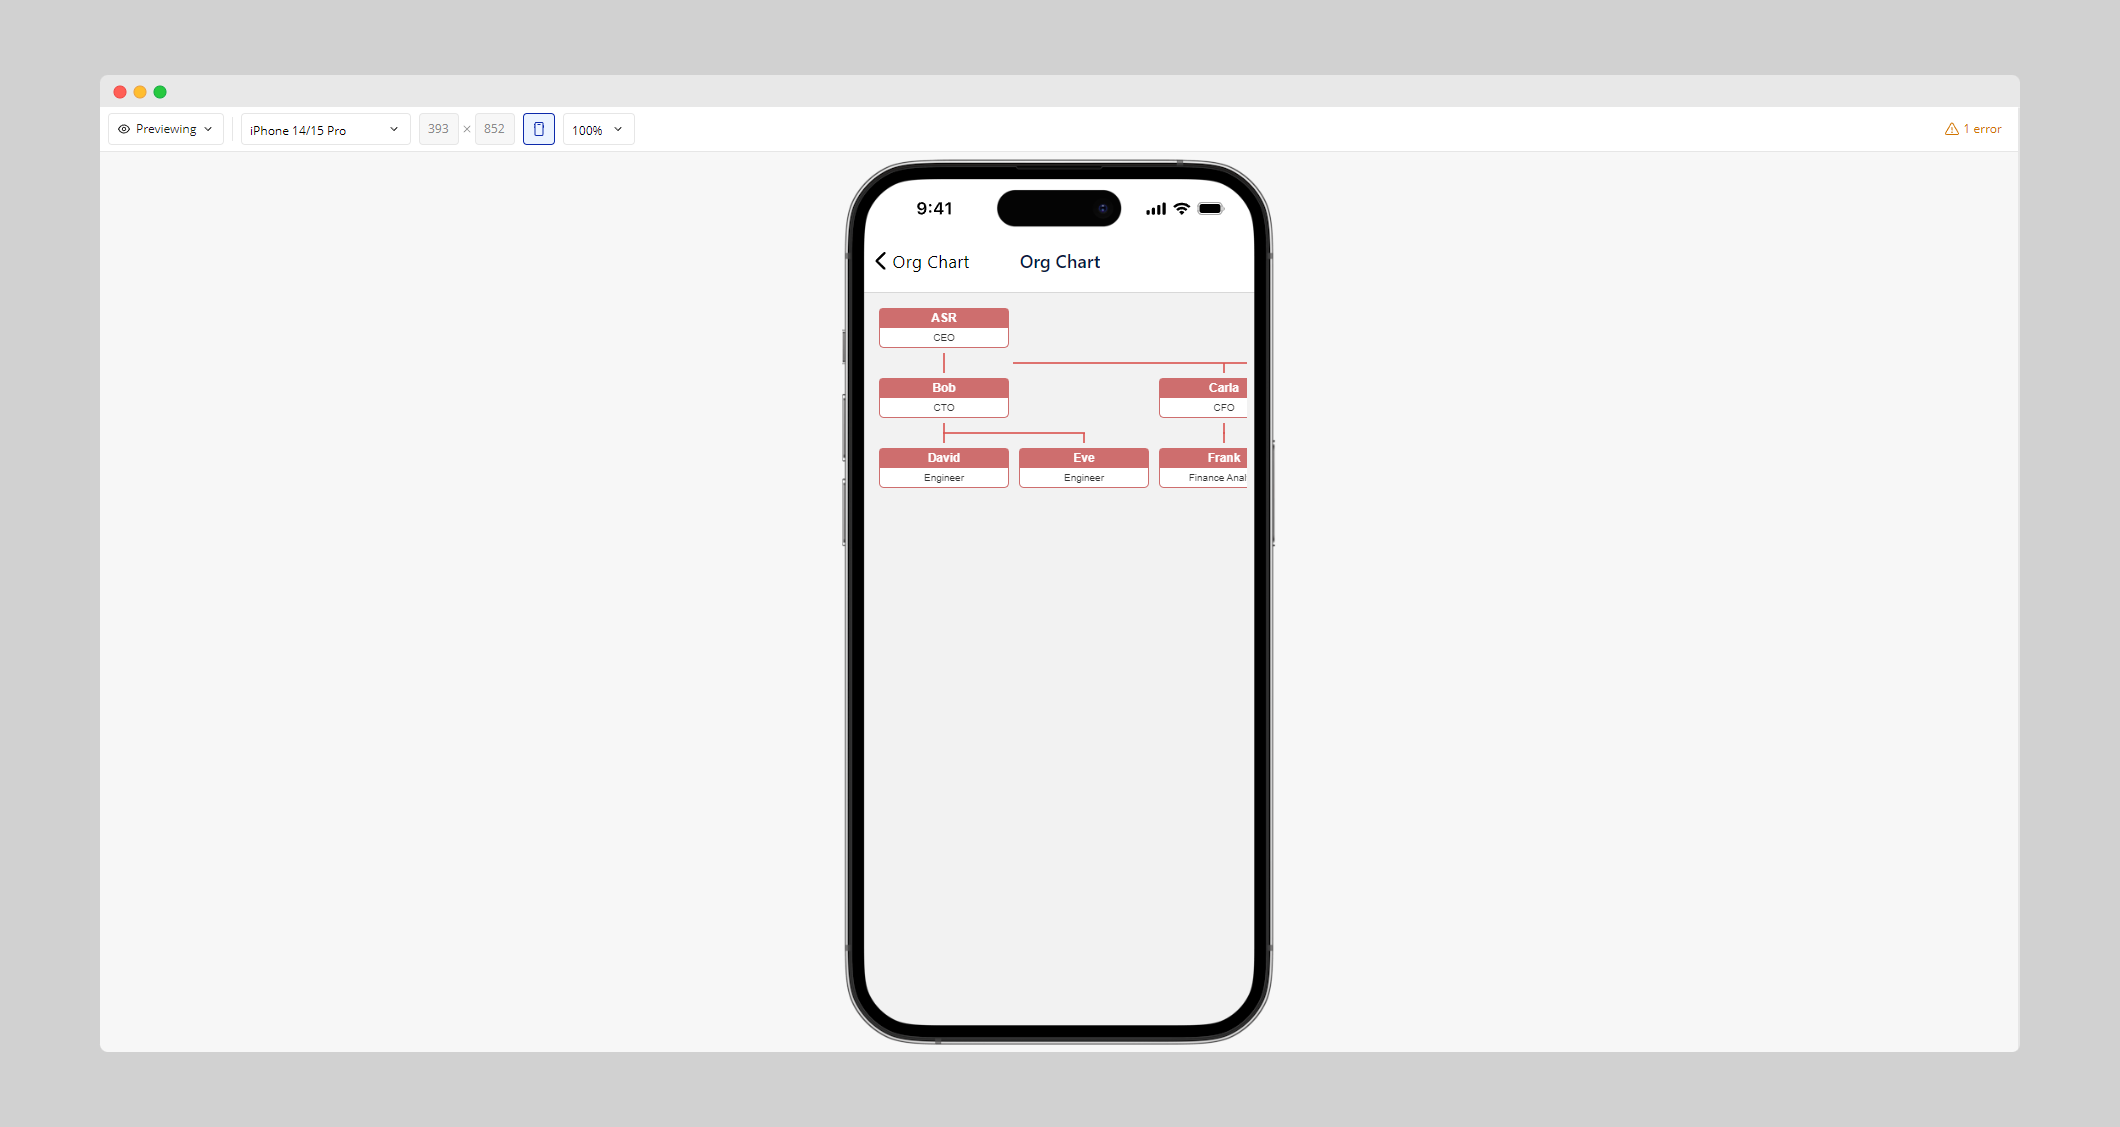
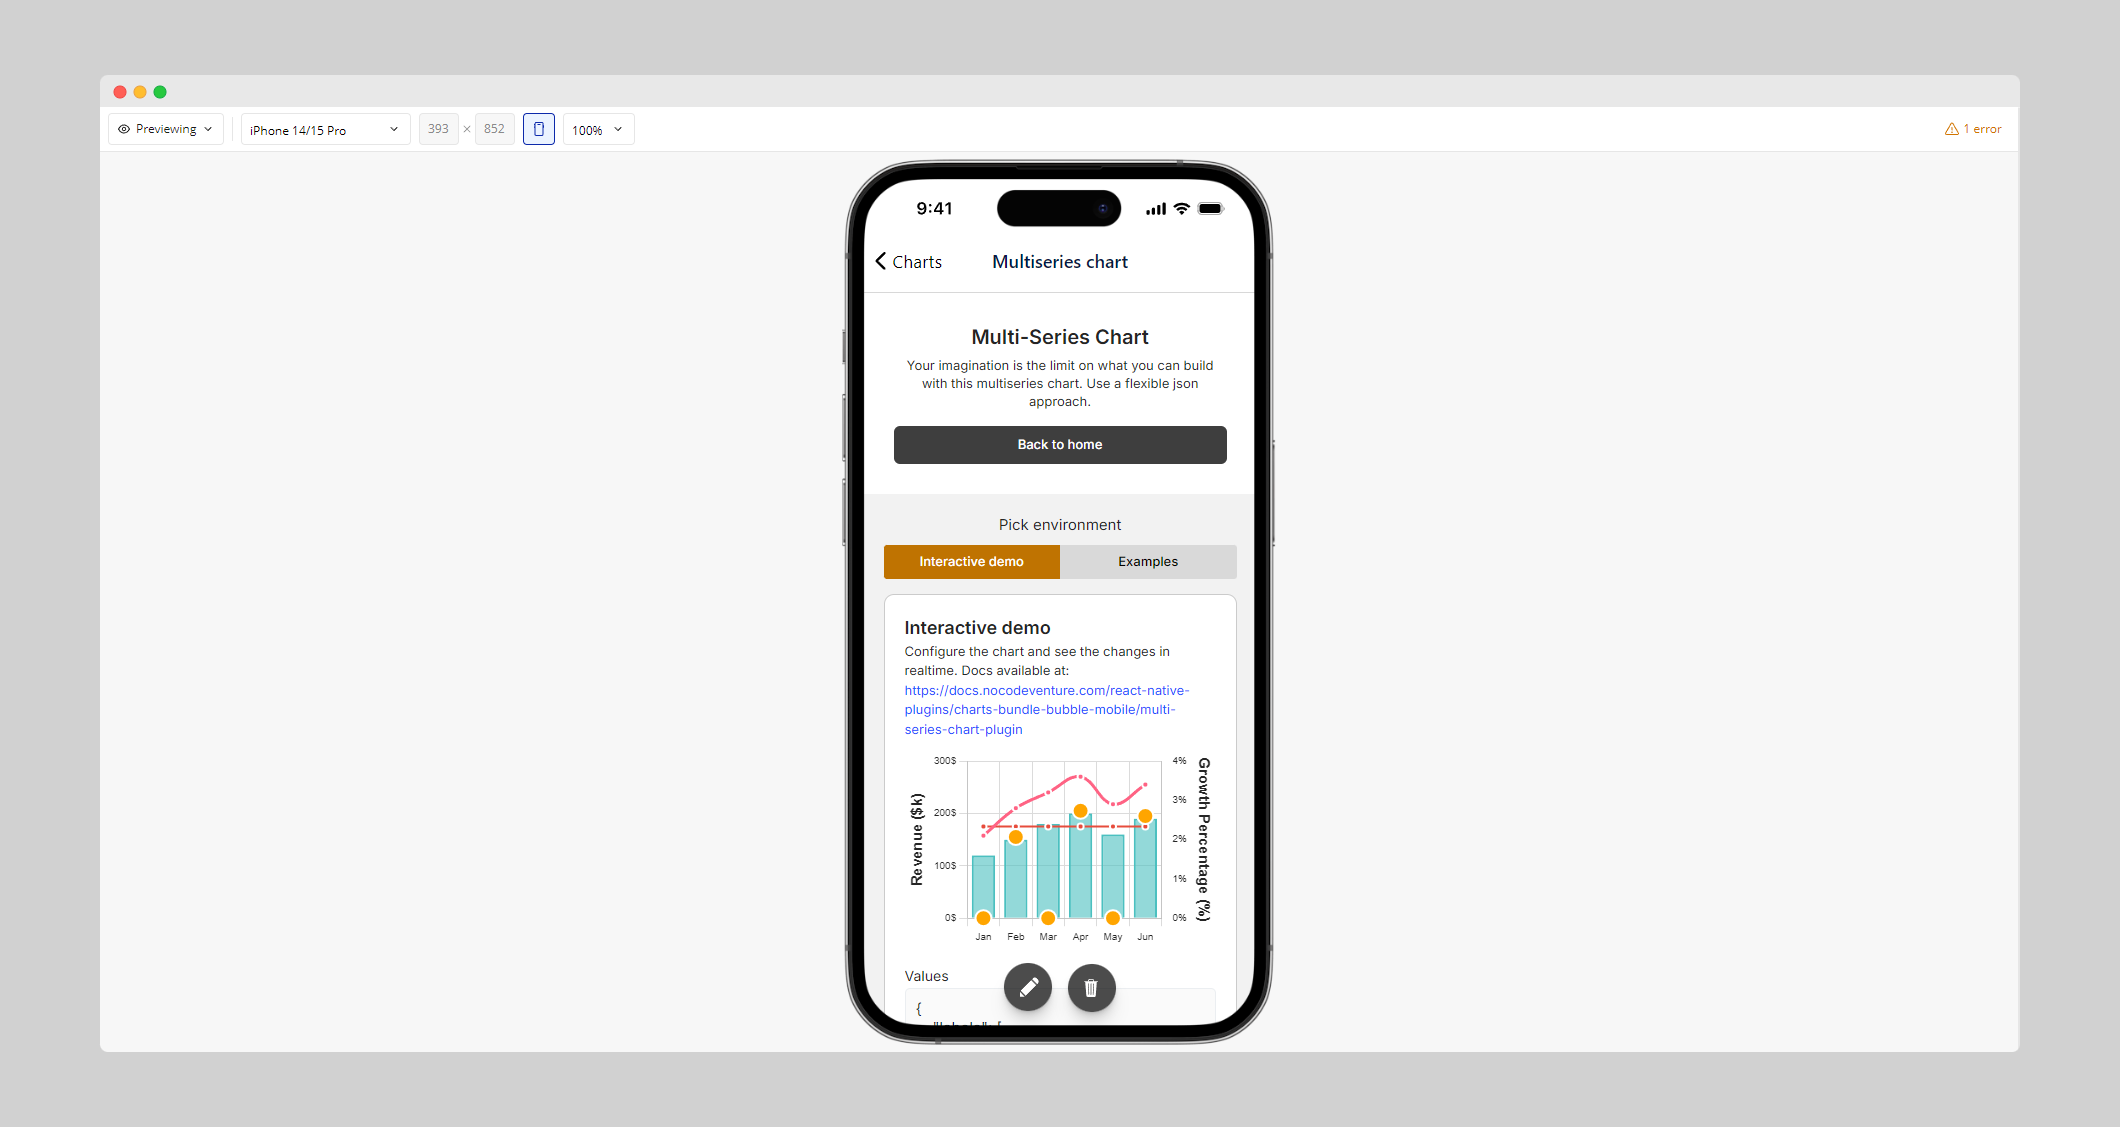
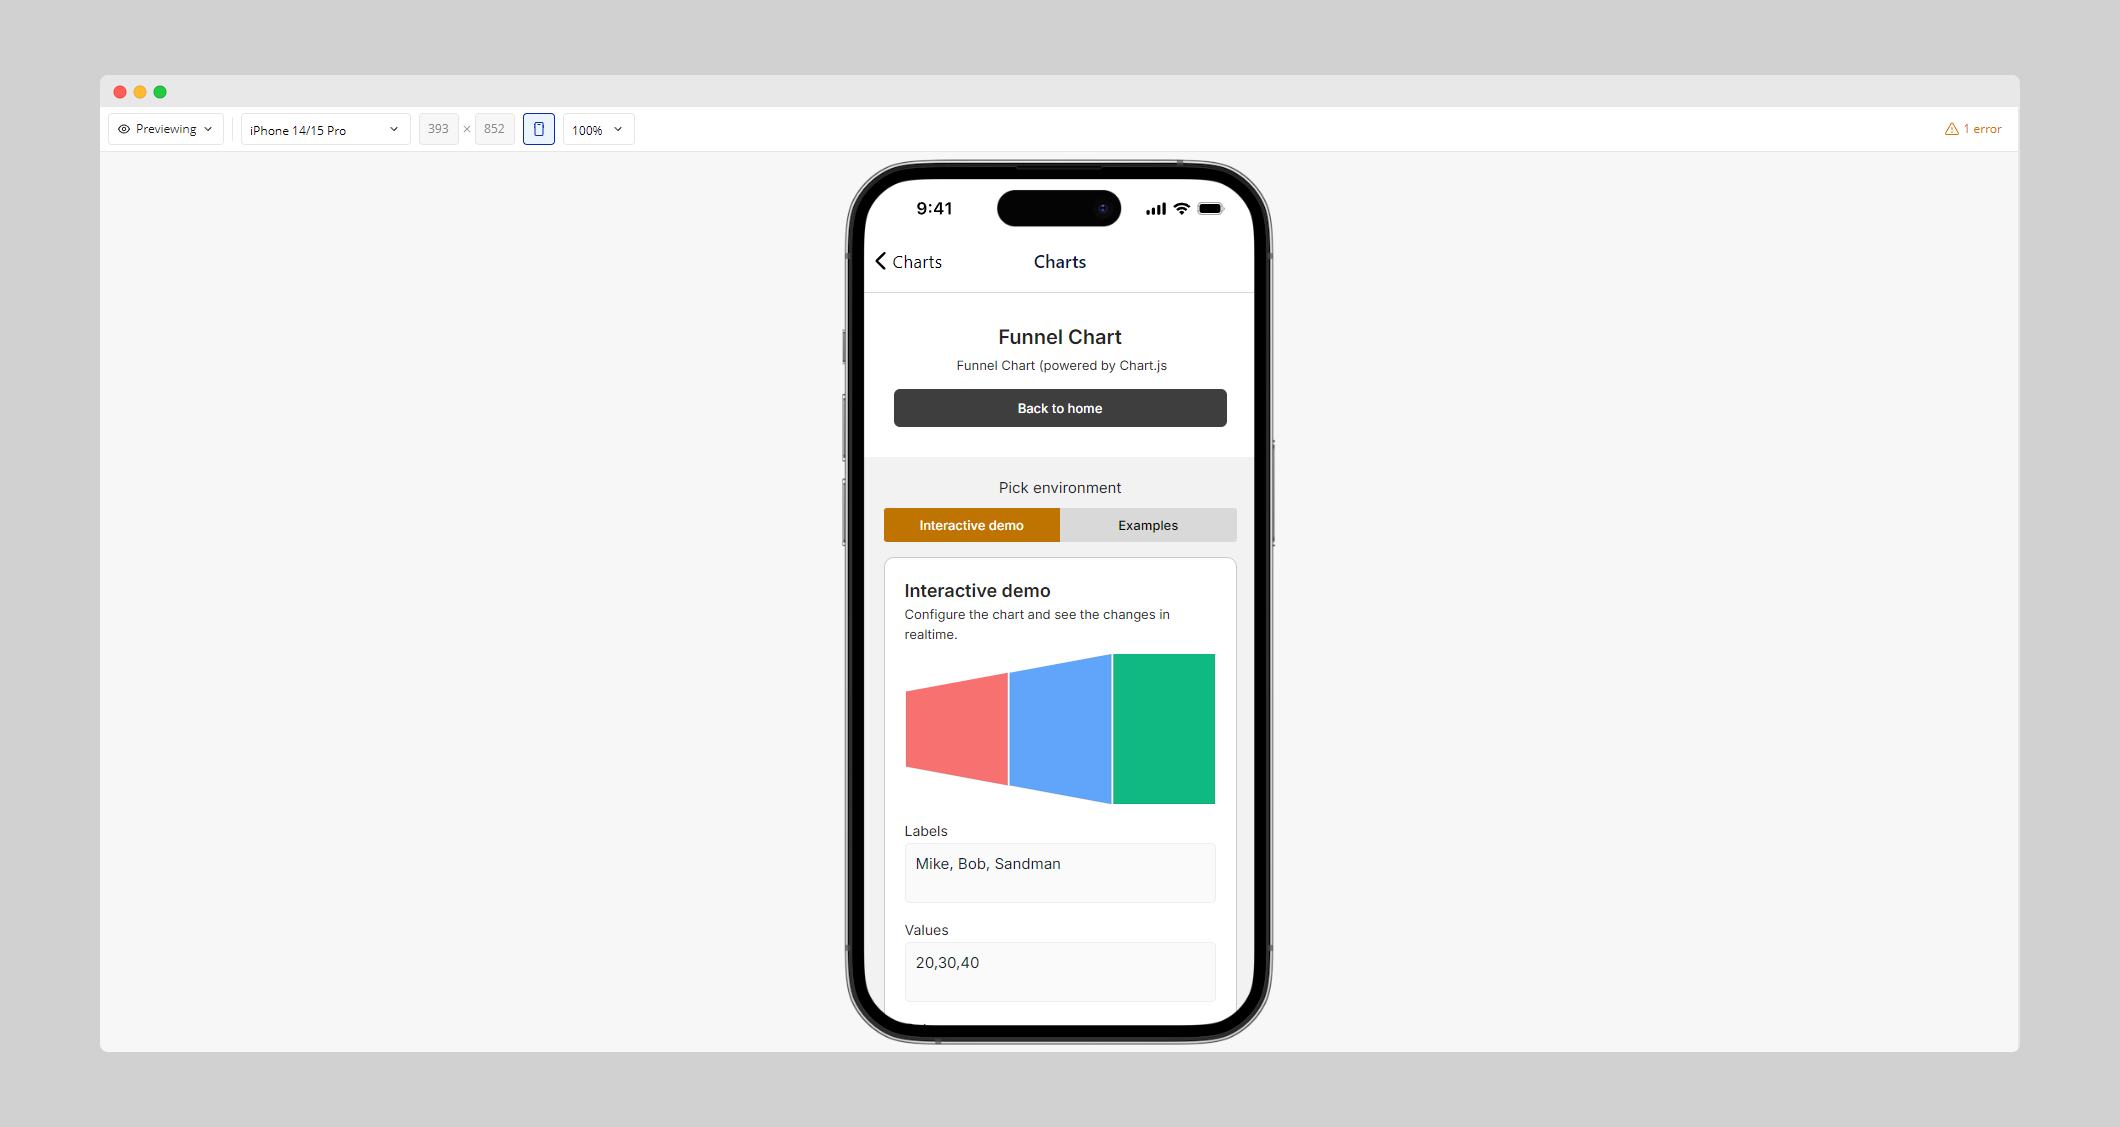
Available Charts (so far)
Bar Chart: Visualize values as horizontal or vertical bars, with support for legends, progress-style fill, and custom styling.
Editor: ncv-react-plugins | Bubble Editor
![]() Getting Started
Getting Started
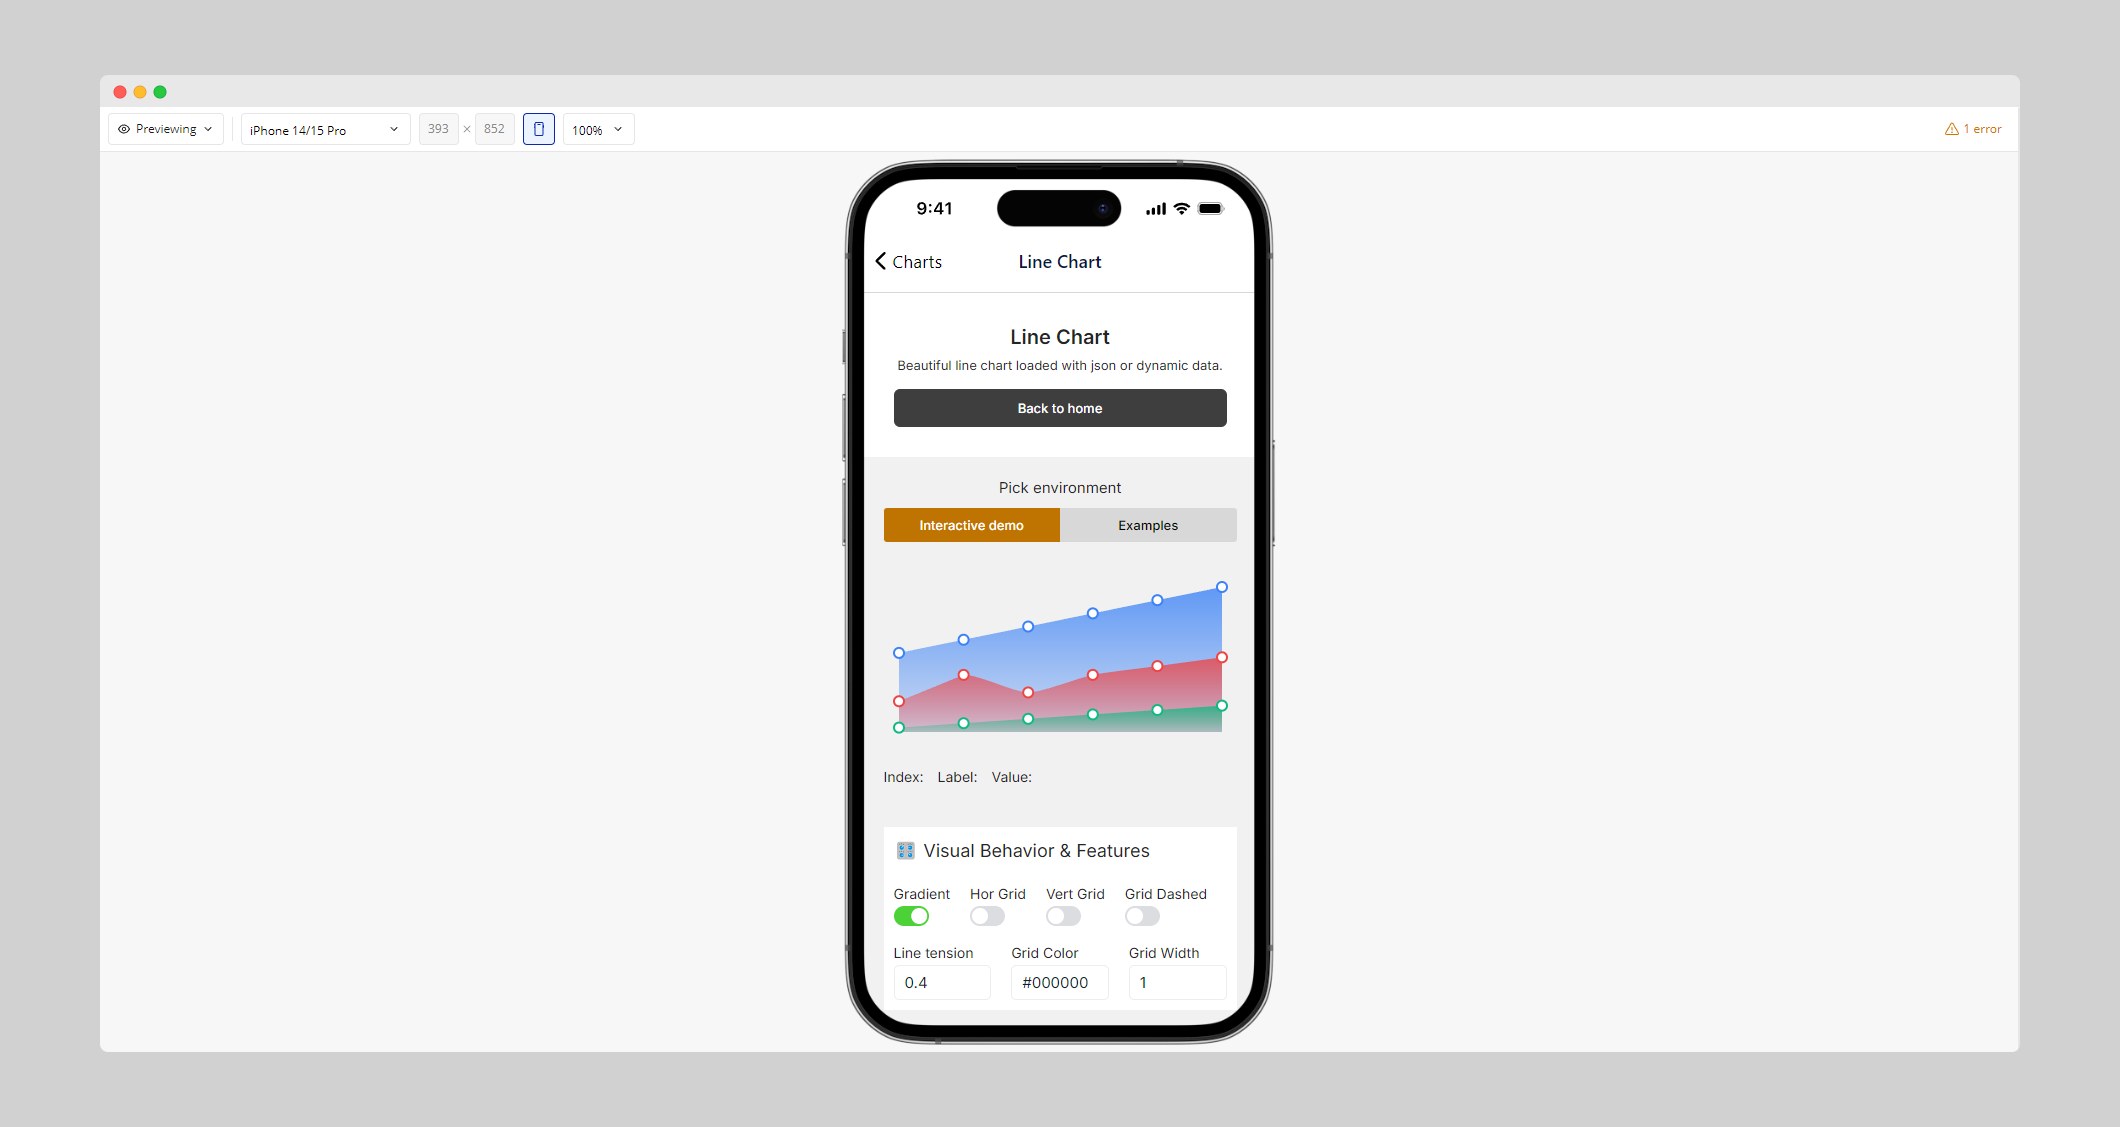
Drop a chart element onto your page (starting with Bar Chart) and configure the available properties. Pass in your data, choose the layout style, and you’re good to go.
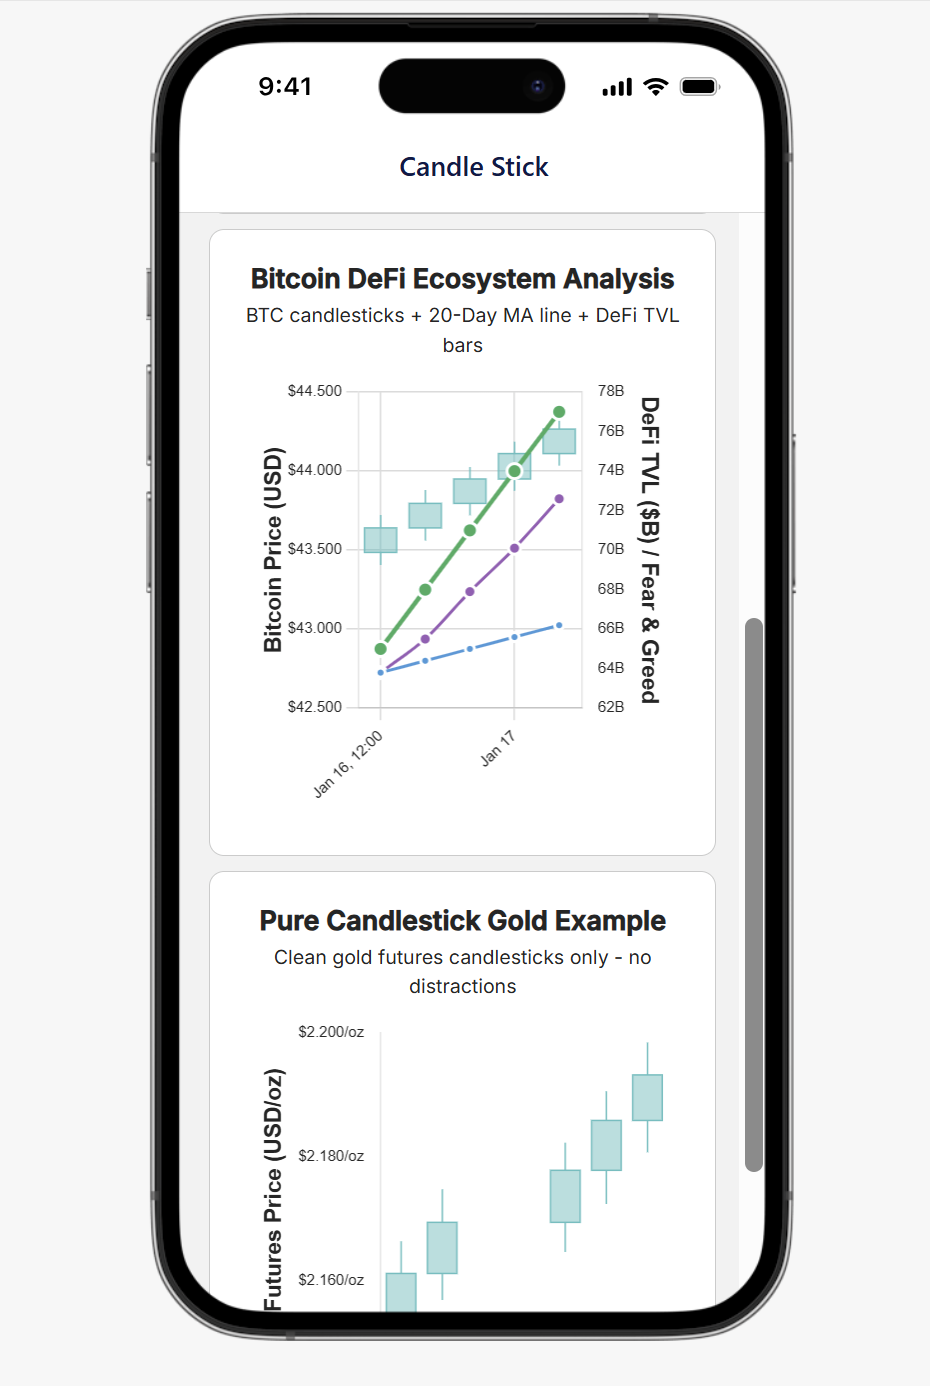
More chart types like Line Charts, Pie Charts, and more are coming soon.
![]() Full Documentation
Full Documentation
For a detailed guide on available properties, interactivity, and future chart types, visit:
Plugin Link: React Native Charts Bundle Plugin | Bubble