Hi, I have a question regarding grouping.
I am using the plugin ApexCharts.js by Thimo and am struggling to display my data on an area chart how I would like.
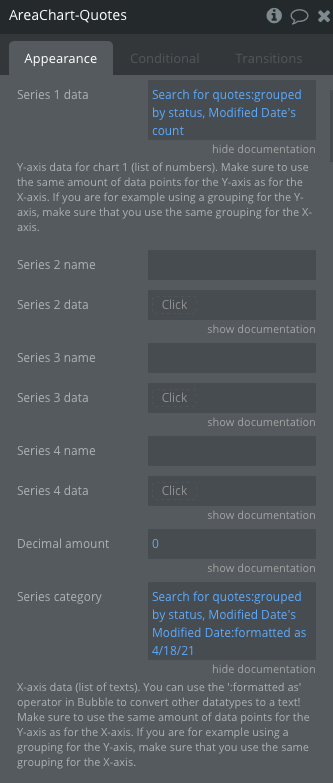
The chart will have 2 series. Series one will count the number of quotes with status as ‘sent’ and the second series will count the number of quotes with status ‘converted’.
On the X axis I want dates to show how many numbers of quotes for each series for a certain day. e.g. If there are 2 sent quotes and 3 converted quotes on 23rd May then on the 23rd may series one will line up with 23rd May / 2 and series 2 will be 23rd May / 3.
I am struggling with the grouping to get this to show.
Any help would be appreciated.
Cheers.
Both the categories and the data need to have the same expression for the plugin to work. Essentially the same grouping logic. Check with @Thimo the plugin’s author for further guidance in case you continue to face difficulties. Thimo is super-supportive! 
Hey Cmarchan cheers for your reply, do they not have the same expression in the screenshot above?
I had given Thimo a message but I don’t think I explained myself well enough, he was a great help for my other questions but he wasn’t too sure about this one 
Rebuild from less to more the complexity of the grouping. Try to get some data to show and adjust from there on.
Try printing that expression to a label and see what it looks like. Could be incorrectly formatted even though it’s being accepted.
That could help reveal an underlying issue of mismatched data or something else.
2 Likes
Cheers mate! Instead of grouping by Status and Modified date, I only needed to group by modified date as a I had already predetermined the status in the search criteria.
Thanks
2 Likes