Users can mark a recurring task complete which saves the date they complete it as a datatype.
I’m trying to display their streak of how many days in a row they’ve completed the task. If they created the task 10 days ago and didn’t mark it complete on day 5 but finished it day 6-10 then their streak would be 5 days
As well as their overall consistency rate. If they’ve completed it 9/10 days I want to display 90%
I’d probably create a sub-datatype of “task-days” and attach it as a list. So each day can have the date, can be marked as yes or no, or can have more complex functions like comments or quantities.
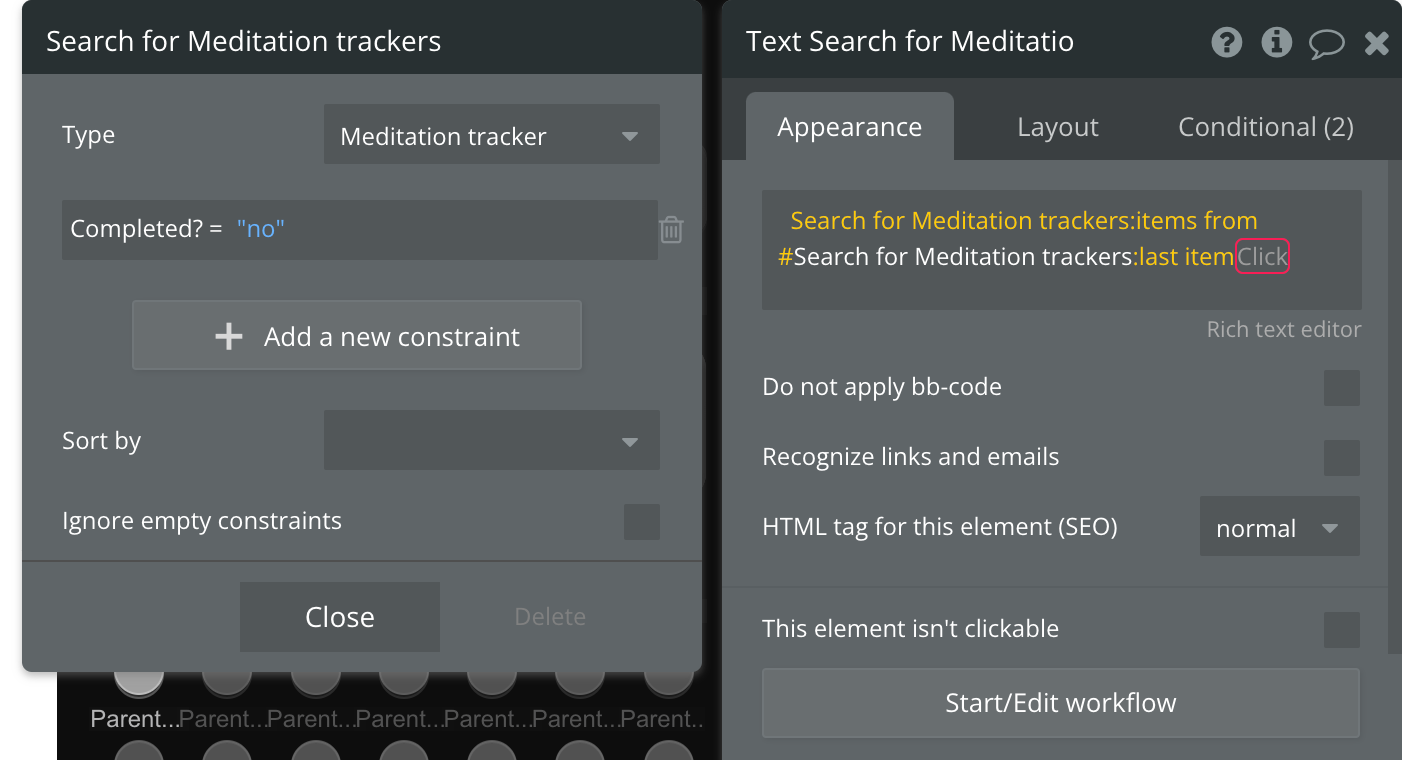
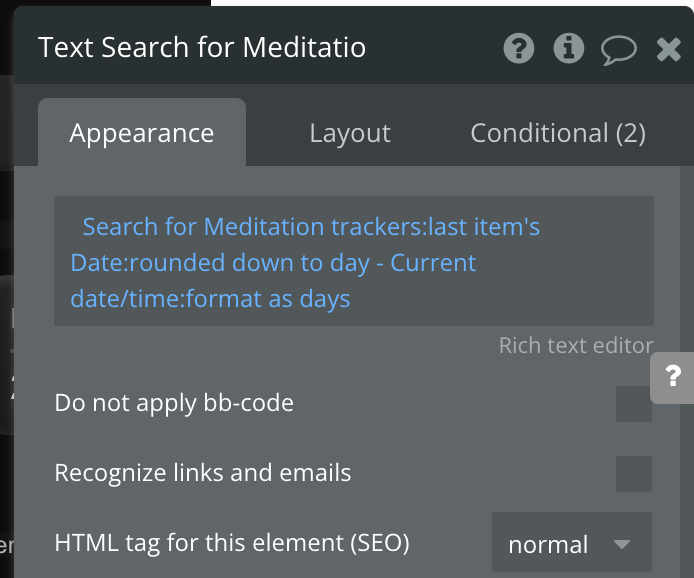
For streaks, you can use the list function “items from #”, and to get the number you can use a second check to find the item with a fail, last item, and it’s number in the list. This works especially well if you save the date “number” to each item as well.
For consistency, you’d then check the list, filter it by complete or not, and use the count function.
I added the date number and got it to work! Thanks for you help!
So if they missed the yesterday their current streak is zero but I’m also trying to show the longest number of days in a row they have gone for. Do you by chance know a formula to find and calculate ?
Ya looks like you figured out that for first item or last item you then need to select which field to display if the desired data type is number, text, etc… if it appears red as an error you can always click the “issues” button at the top right and it will explain why it is an issue. For example, “you are trying to set a text data type but this data type is a deal”.
Part of the trick in all of this is just learning how to think how Bubble thinks, and learning what functions are available to use to accomplish what you’re thinking of.
In light of this, my first thought for what you’re asking is “how can I separate a list whereby I create multiple sub-lists with a delineator/division by failures and a count of the successes, resulting in a list of numbers, and then sort them by value to find the largest?” In this case you’ll want to play with the group by function. If you hover your mouse on it, “see reference” appears and it will teach you how to use it. Very useful for analytics and data like this.