Hi, I have an array of numbers in a database where the odd numbers are x axis and even numbers are y axis. That means each point of a chart is two following numbers. How do I separate these numbers to plot a chart from them?

Thanks
Hi @Tetrev!
First question is: Do you have any experience with charts?
Because we have to issues here:
- Separete these numbers in two groups (odds and evens);
- Use the result to build a chart;
Do you need help to all of this?
Hi, I am starting with bubble so no experience, but there are many tutorials for the charts. Currently my biggest issue is to separate the numbers.
Hi @Tetrev !
For sure the biggest issue is to separete the numbers. But it is not a big deal.
Here are some steps you can use:
-
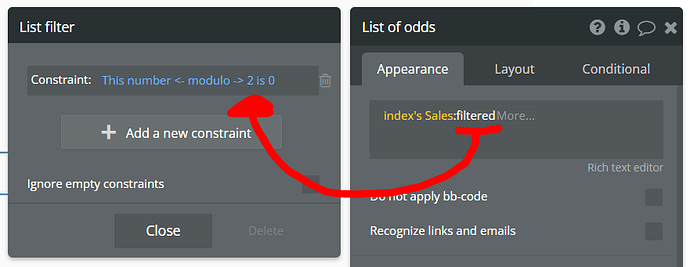
Create two custom states in your page. One called “odd_list” (Type: List of Numbers) and the other called “even_list” (Type: List of Numbers).
-
Bubble has a command called “<- modulo ->”, that returns the remainder when the first number is divided by the second number. For example, ‘5 ← modulo → 2’ becomes ‘1.’
-
So, you will populate your odd_list only with the numbers that, divided by 2, don’t generate any remainder. And you will populate your even_list only with the numbers that, divided by 2, generates any remainder.
-
ODD_LIST
- EVEN_LIST
- Now you have both lists. One with the odds numbers and the other with the even numbers.
Hope it helps! ![]()
Hi @rpetribu,
that works perfectly to sort the odd and even numbers from the list. But I probably incorrectly formulated how I need to sort the numbers. I need to separate every second number from the list. So the one list will be: 5979200, 5979636, 5980452,…and the second list will be: 18312, 23315, 49312,…
Is it possible to do that also by the custom states?
Hummmm…
In this case, it will not be that easy. But you can do it using a simple Javascript snippet.
First, you will need to download a plugin that allow you to use javascript inside Bubble. Search for “Toolbox”. It is free.

You will have a new visual element called “Javascript to Bubble” in your editor. Add two of them into you editor. Just like the images below. One for each list.


In your Workflow, you will need to add the Javascript code. Just like below:
** Note that Index’s Sales is where MY list of numbers is. You should load your list of numbers there.
var numbers = [YOUR_NUMBER_LIST];
var odds = [];
var evens = [];
for (var i=0;i<=numbers.length; i++) {
if (i % 2 == 0) {
evens.push (numbers[i]);
} else {
odds.push (numbers[i]);
}}

bubble_fn_evens (evens)
bubble_fn_odds (odds)
That’s it ![]()
Now you can access both lists using:

Tell me if it works for you!
That works exactly how I need! Thanks a lot 
Great! 
This topic was automatically closed after 70 days. New replies are no longer allowed.


