
Thanks Merhdad. Getting so close!
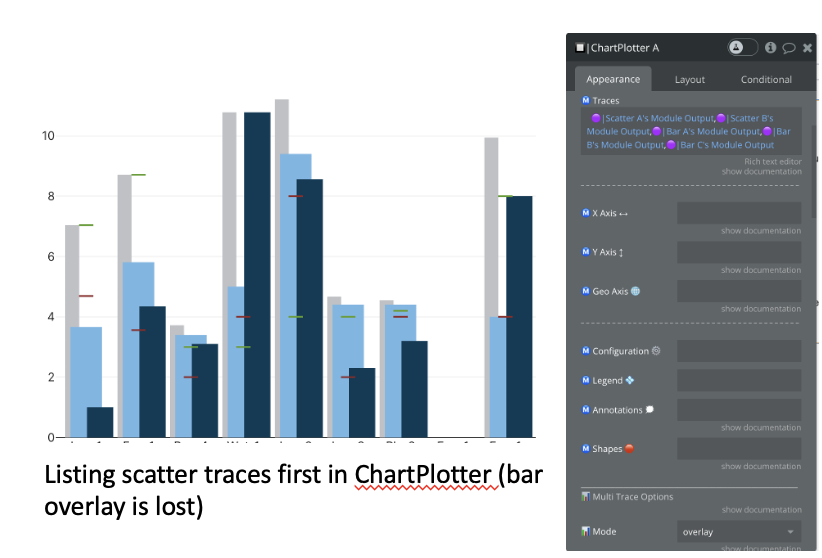
I can get the lines (symbol 41) to display following what you provided. However, when combined with the bar chart they outline the bars instead. If I list the scatter traces first in Chartplotter, the lines show but I lose the ability to have the bar charts shown as an overlay.


1 Like