
Hi,
Having issues displaying sensor data into a line chart.
I currently have a workflow to update the Value Expression (Y value) every 5 seconds, with the X value being the current time.
The Y value updates, but stays at the same point on the X axis, instead of updating over time.
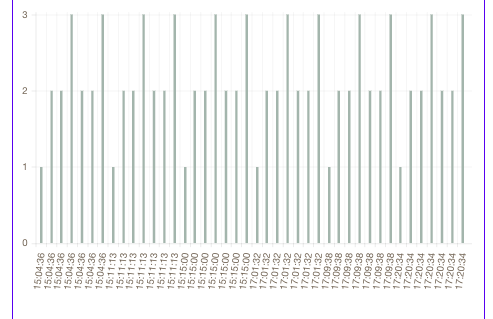
The output is below:


When the page is refreshed this is its output. However i would like the chart to refresh on its own. So far, using a group does not refresh the graph…
Can someone please assist with this?
Thanks,
Abby