Hey Bubble team & community,
I wanted to surface something strange I noticed on the status.bubble.io page today that doesn’t align with our app customer’s experiences or what’s being reported in the forum.
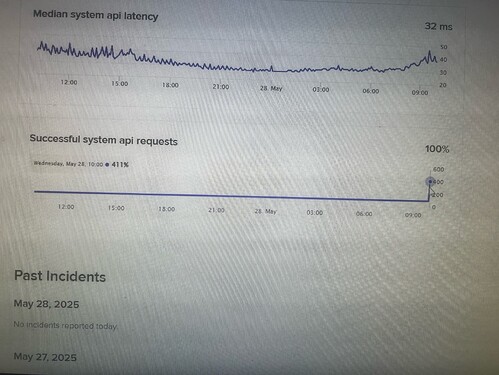
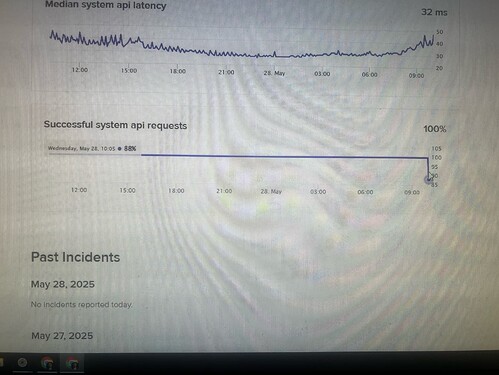
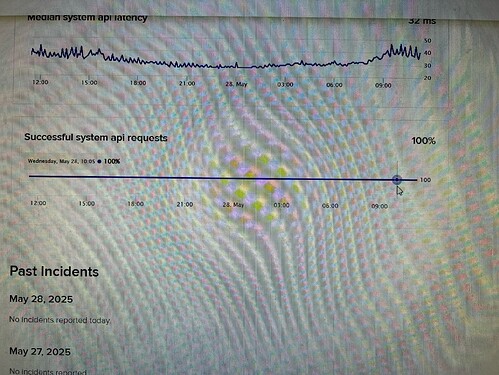
At different times this morning (May 28), the “Successful system API requests” metric showed:
- 411% success at 10:00 AM (not a typo - four hundred percent)
- 88% success at 10:05 AM
- Later, the entire chart flattened to a clean 100% for the same time window
Meanwhile, multiple users are reporting degraded performance during this exact window.
![]() Either this is a visual/reporting bug, or metrics are being revised after the fact to downplay or erase issues. At minimum, the dashboard seems unreliable, and at worst, it suggests the status page may be masking real-time problems that affect workflows and customer trust.
Either this is a visual/reporting bug, or metrics are being revised after the fact to downplay or erase issues. At minimum, the dashboard seems unreliable, and at worst, it suggests the status page may be masking real-time problems that affect workflows and customer trust.
@fede.bubble
![]() Can someone from the Bubble team clarify:
Can someone from the Bubble team clarify:
- What data source powers these graphs?
- Why did the success swing from 411% to 88% to 100% with no reported incident?
- Are these metrics editable or retroactively cleaned?
I’m attaching photos for reference (sorry for potato quality), but if other devs saw similar numbers, please chime in.
Transparency here matters. We’re building businesses on this platform.
Dillon


