Hi all, I’ve been experiencing a crazy WU spike in the past hour, spending 15,000 WU in about 25 minutes. At first, I thought it had to be a recursive workflow that’s gone haywire, but looking through the logs and app metrics, it turns out that wasn’t the issue.
All of the WU were spent on a single RG that was fetching data constantly. 12600 searches in 25 minutes, from a single browser (I’m the only one with access to this development branch and the RG is not live in any other branch). The moment I refreshed my browser window, the searches and WU seized.
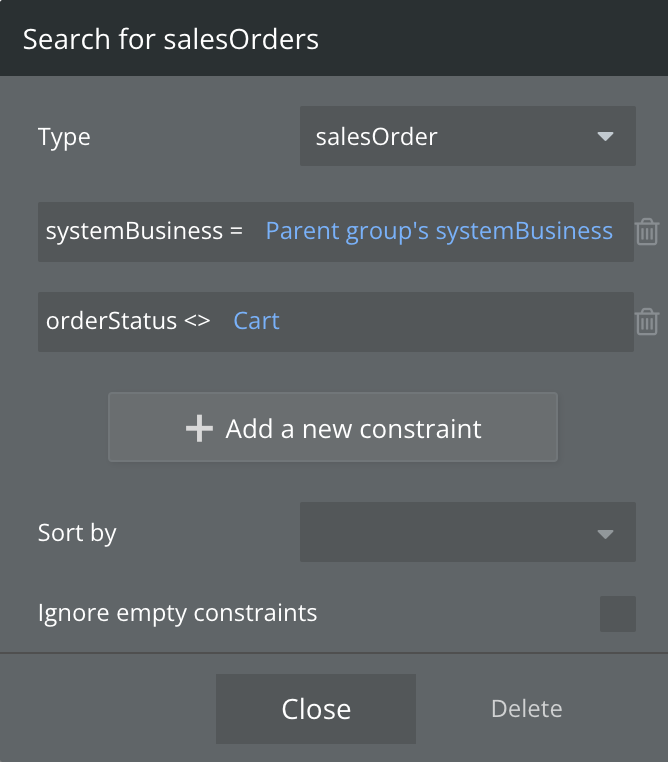
The RG that was causing the spike was fetching data from another RG that is getting data from a very simple search, just two parameters, and there are less than 50 entries in the development database.
After seeing this spike, I started reviewing our logs in the live branch which has a good amount of monthly users (around 500), and noticed that a similar spike occurred in the live branch overnight. The spike went on for about 10 minutes and it was fetching data from a simple search query (also 2 parameters as you can see below). This spike went on for about 10 minutes, ending the same minute as a specific user was last active (we’re tracking when users are active using a recurring workflow that updates the user’s ‘last active’ field every 60 seconds).
It looks like the one overnight was our first ever significant spike not caused by expected increase in visits over a short period of time due to ads. Has anyone else experienced these types og spikes before (caused by fetching data in an RG)?
Do you have some logic (e.g workflows) set up in your app that would cause the constraints (or the values of the constraints) to change recursively, triggering a new search lots of times per second?
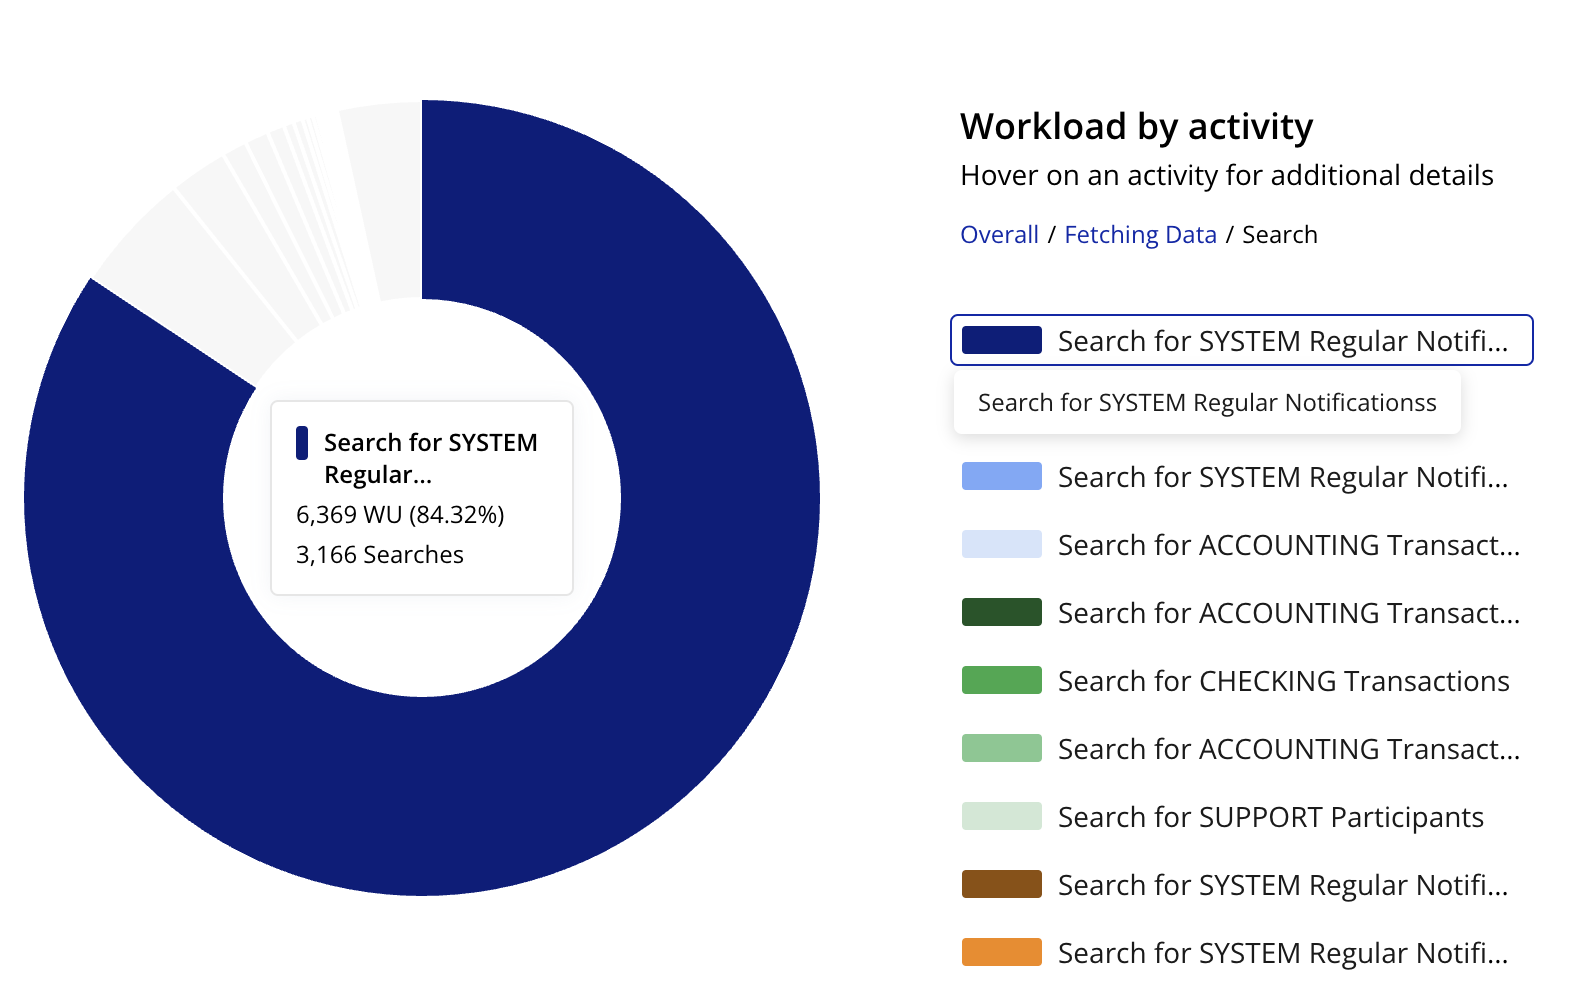
The live spike overnight was in an RG with very simple notifications. They are only edited through a single workflow which is the one marking the notification as seen. That RG’s been live in its current form for about a year, without any changes, and this is the first spike resulting from data fetching. The one that just occurred in the development branch is for a data type that is edited frequently, but the constraints in the search query rarely changes.
Are you using any visual element plugin in a repeating group that isn’t a native Bubble element? Or any hidden repeating groups? It’s hard to say exactly what might be causing it without looking under the hood in the editor
It looks to me that the expected results of the Search is large. So while the initial search might return a few, whenever your other RG has to do a sort (based of that dynamic field), it will cause the search to run again to ensure that the sort is maintained. Whether it’s a bug or as intended, only Bubble will know.
Why not store your search in a state list first, and then refer to that state for your dynamic sorting.
When I think about it, yes I probably did, but I was developing less than an hour before the spike occurred. I had certainly refreshed the browser less than 1.5hrs before the dev branch spike.
If that was indeed the case, I would expect to bave seen this issue before, but it’s the first time and we’ve used this setup across the platform for about two years. The spike in the live branch was in an RG that’s remained unedited since early-2023. Either way, I can’t imagine it being anything other than a bug. I mean, an average of 8 identical searches per second for 25 minutes…
On the suggestion about using states, we’re doing this in some places, but only for data types that don’t need to stream in and stay updated. Appreciate the suggestion though, might go for that as a temporary measure until Bubble responds.
It’s likely the reason since your RG is populated by a data type you say is edited frequently…if it’s not leaving the browser open that did it, it’s a bug, but I think it’s the browser left open and the data type getting edited frequently
It’s exactly this kind of spike that I’ve been contacting support about over the last year. For me it’s not coming up as RG searches, it’s just “individual data request”.
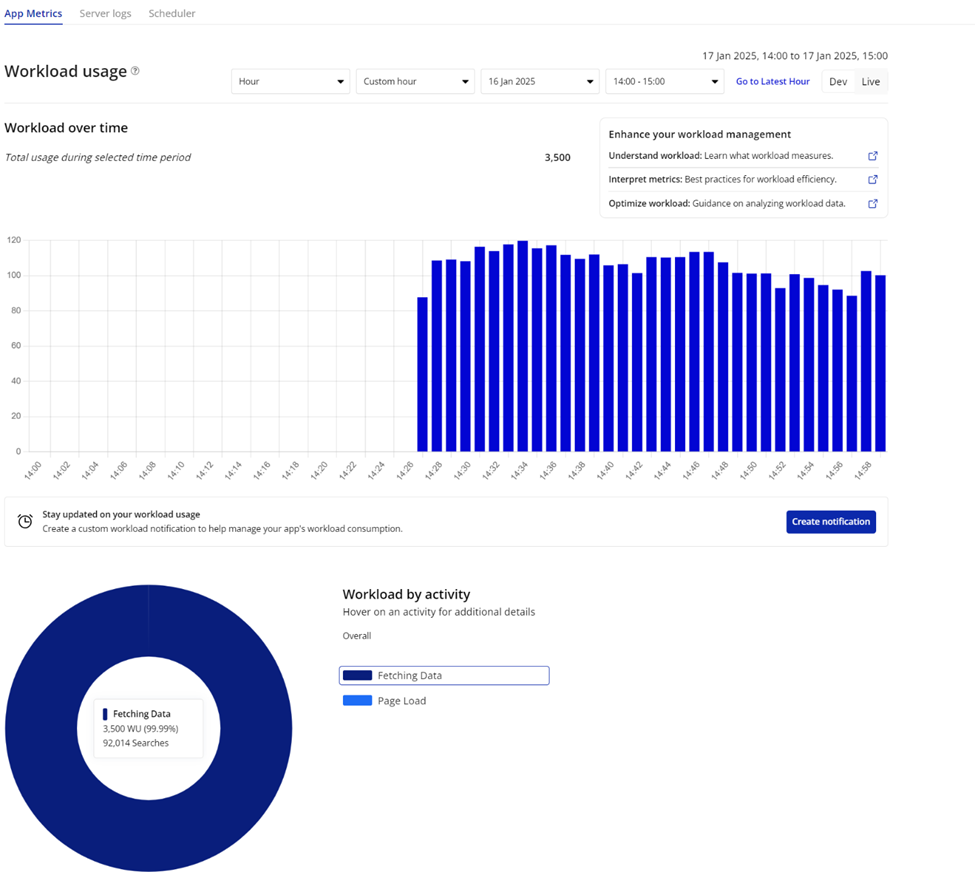
Look at my latest example.
No usage/execution between 14:09 and 15:40 in the log.
Then look at the timing of the spike. Crazy!
Both sorry you’re experiencing the same issue and glad I can confirm others are too. I received a response from Bubble Support after about 4 weeks. At that point, data about what caused the spike had already expired and been deleted, so there was essentially no help at all. I’ve experienced the spike once more after this post, and that was in late December.
Let’s continue to report the bug, and hopefully they’ll eventually be able to identify the issue. I’m linking to this forum post in the bug report.
Haha, I hope not (and don’t believe they are). They ignored my request for them to reimburse the cost for the overages. Should have pressed the issue, but didn’t.