
Hi Alex @alex4,
I am working with some stock charts using Area charts in Charts.js, and it’s coming together well.
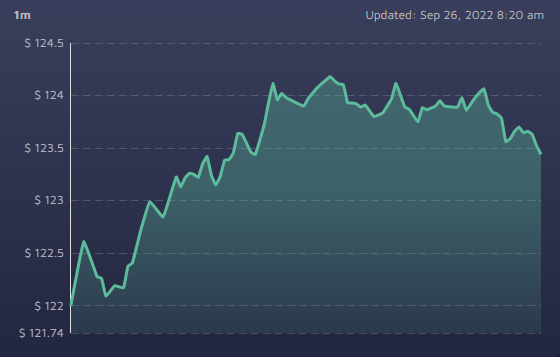
My question is whether or not it is possible to draw a horizontal line over that chart at a pre-defined price point. For example, in the image below, is it possible to draw a colored horizontal line at $123?
If not I may have to try to play around with overlaying another transparent chart on top that can discern the same Y values and place a line accordingly, but I thought I’d check.
Thanks!
Dan