I am using some javascript in workflows and an html element to draw a bar chart. It uses the Chart.js library
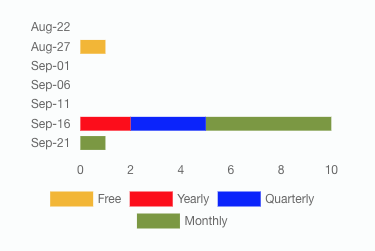
When I use the dates associated with my data for the labels, the dates are interpreted by the chart as numbers and performs math…so for example if I am showing a month followed by day as 10-14, the date is returned and displayed as a label of -4
Here are some screen shots of the charts as they are drawn
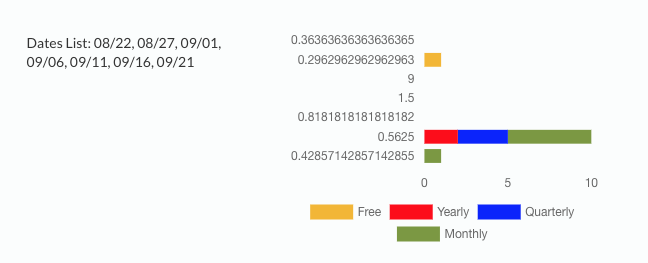

On the left side the “Dates List” are the dates used as labels in the chart on the Vertical Axes. The “Dates List” is actually coming from a custom state I created as a list of texts and I send the information through by formatting the dates like below
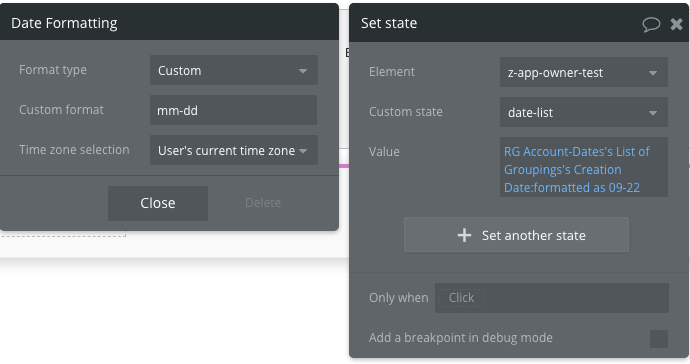
I did this because I was experiencing these issues when using the dates in the javascript for drawing the charts and thought that if I formatted the dates which turns it into a text data type, the chart would recognize it as a text and not have this issue, but that did not work.
I then looked at the Chart.js documentation concerning time
and attempted to implement the axes time type but that causes the chart to not be drawn, and oddly enough it does not cause an error message in the debugger.
What is strange is that when I send a date into the javascript for the chart I get an error code in the debugger. This leads me to believe that when I am using the time type in the axes and no error code is shown in the debugger, there is not an error, but for some unknown reason to me the chart is not being drawn.
Below is part of the Javascript I am using
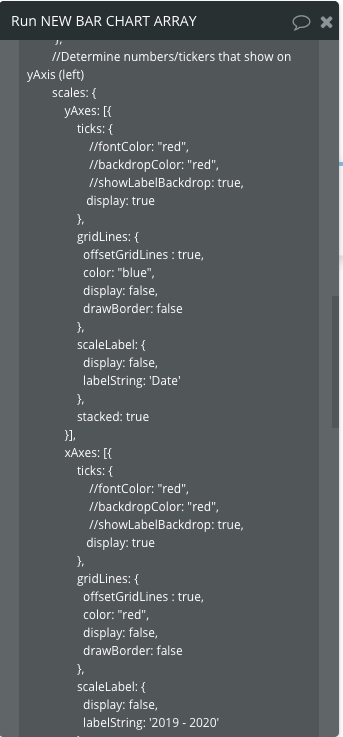
When I try to add the time type the javascript looks like this

This does not produce an error message in the debugger so it seems the code is fine, however the chart does not get drawn.
Does anybody have experience with Chart.js and have used dates as labels? I have spent hours trying to find a solution to this with no luck.