
I have following date values in database:
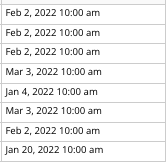
I am aggregating values on month, below is the rule for X-axis:
![]()
Following is the rule for Y-axis:
![]()
I have grouped on month via given rule in both the cases:

But in the graph, all the rows are getting mapped to Jan & Feb instead of Jan, Feb and March. Can someone help with what I am missing here?
I am using Chart JS plugin.
1 Like