I have a database with a list of people who made referrals to a business, sorted by date. Fields are below:
- Person’s Name
- Number of customers referred
- Date of referral
The database contains multiple entries that have the same date, but where the people are different:
- Person A referred 4 customers on August 6
- Person B referred 2 customers on August 6
- Person C referred 10 customers on August 6
I’m trying to display this data in a graph where the X-Axis shows individual dates (August 6, August 7, etc) and the Y-Axis shows the number of customers referred on that date.
What query should I write so that the X-Axis displays ONE date with ALL referrals made on that date, rather than multiple points for each date? Is :unique elements the way to go?
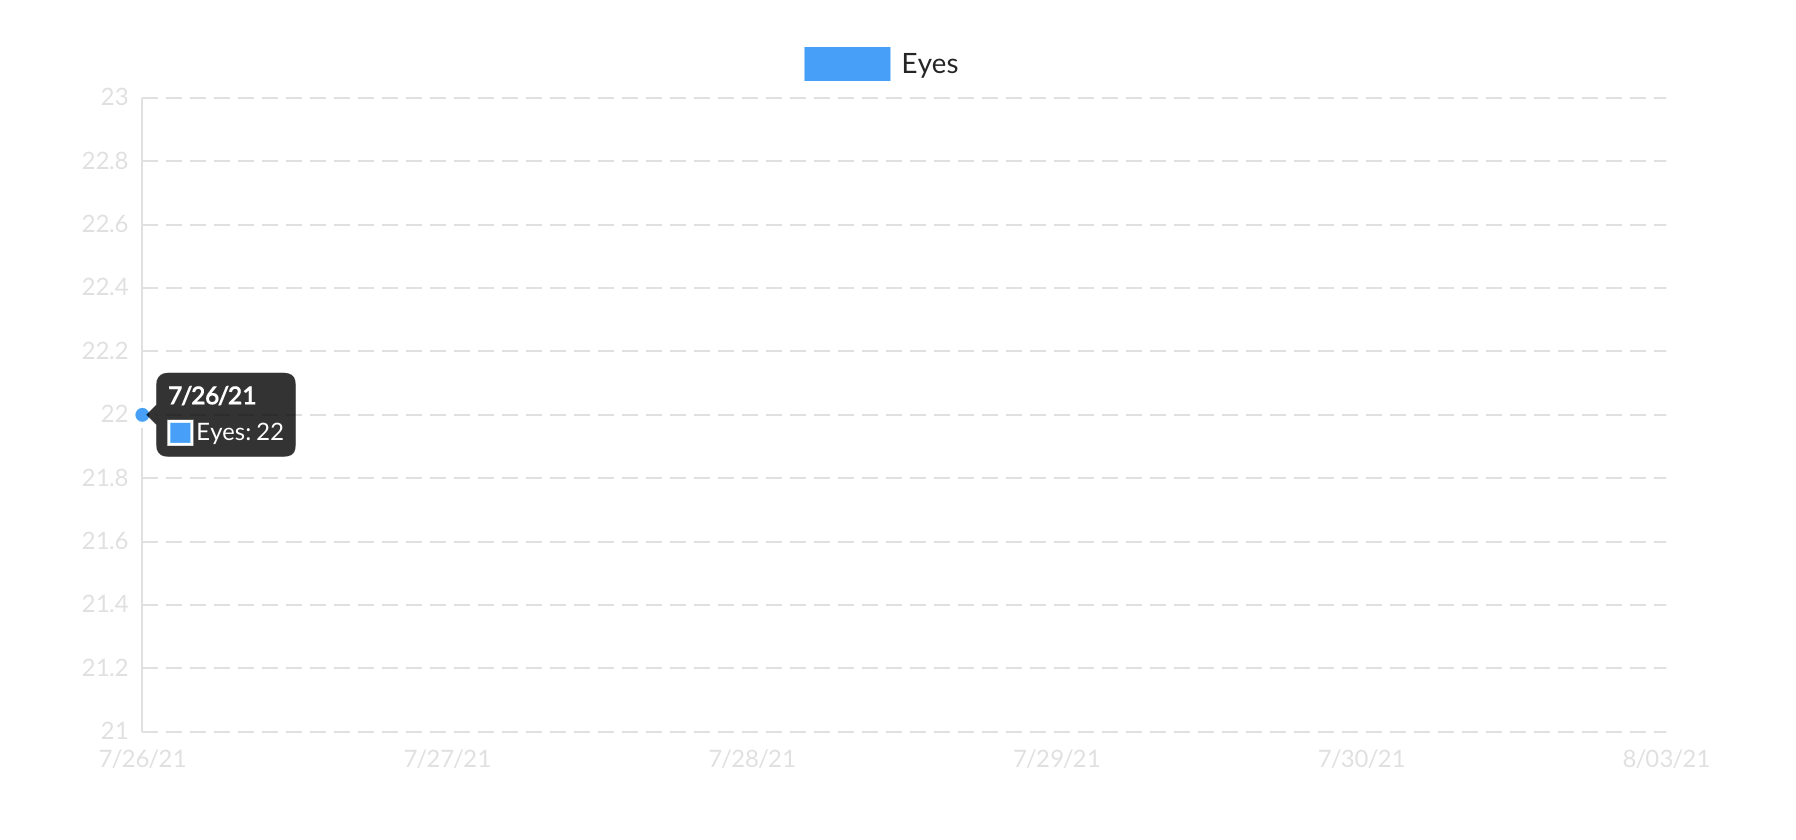
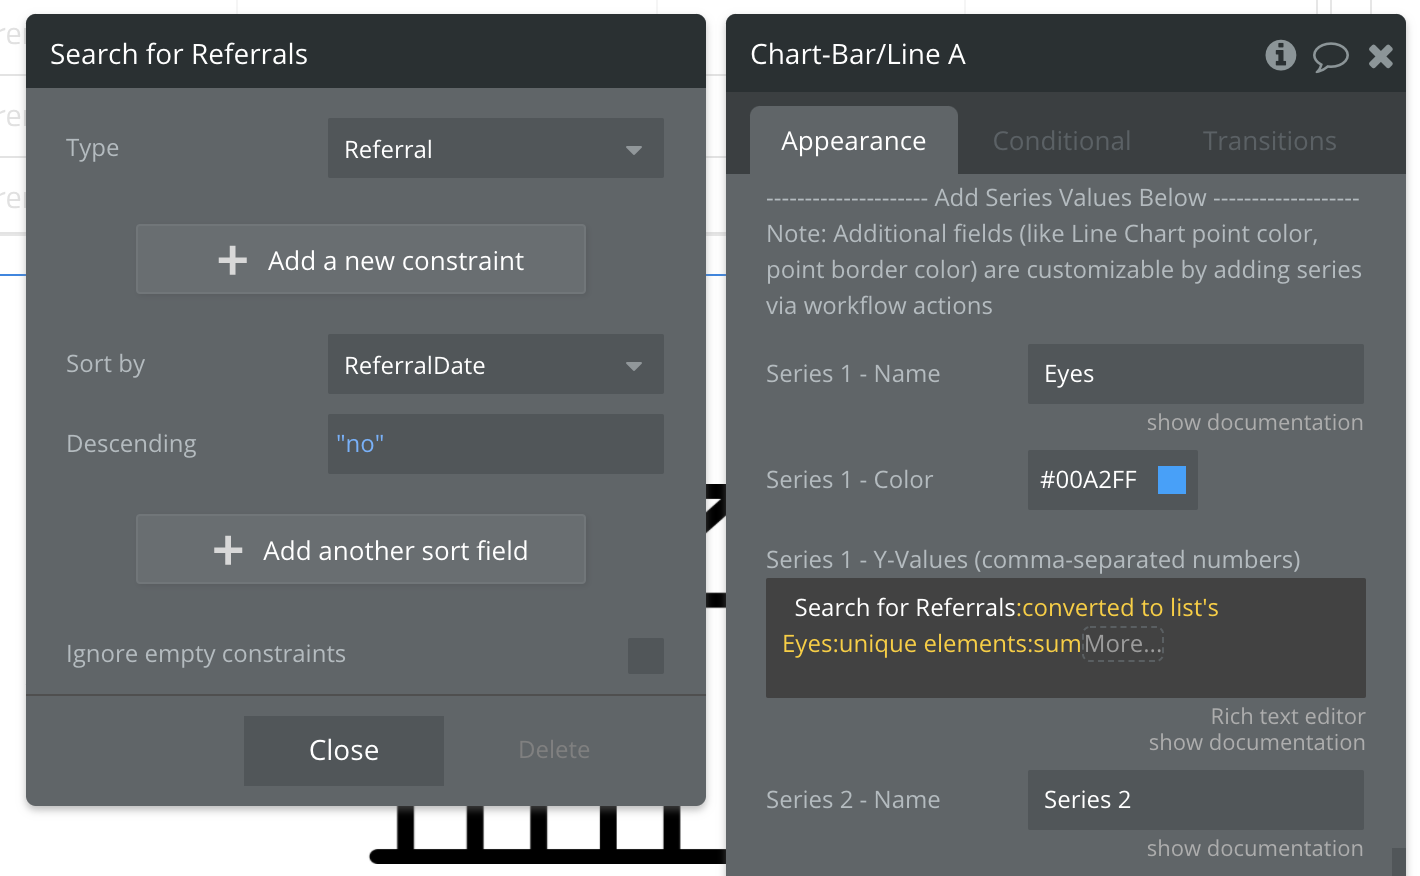
Screenshot attached of the query I’ve written so far, with another screenshot of what it’s gotten me. So far it has successfully graphed the referrals for the first date in my database, but I’m struggling to get it to graph data for other dates.
Thanks in advance for the help!
X-Axis Values

Y-Axis Values:
Graph: