
Hello!
I’m building an app that monitors sales, and within the app the user is able to define the ‘last selling day’ of each month. A sale made on or prior to this day will count for the current month, and a sale made after this day will count for the following month.
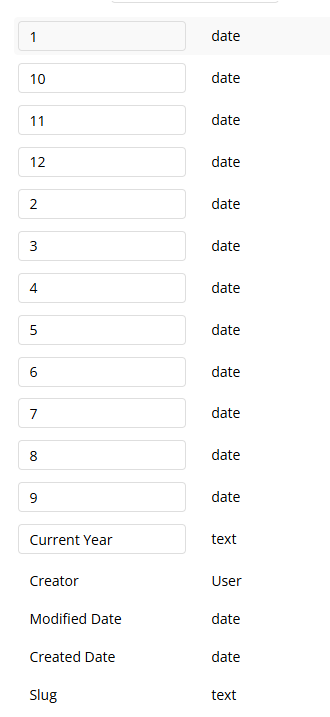
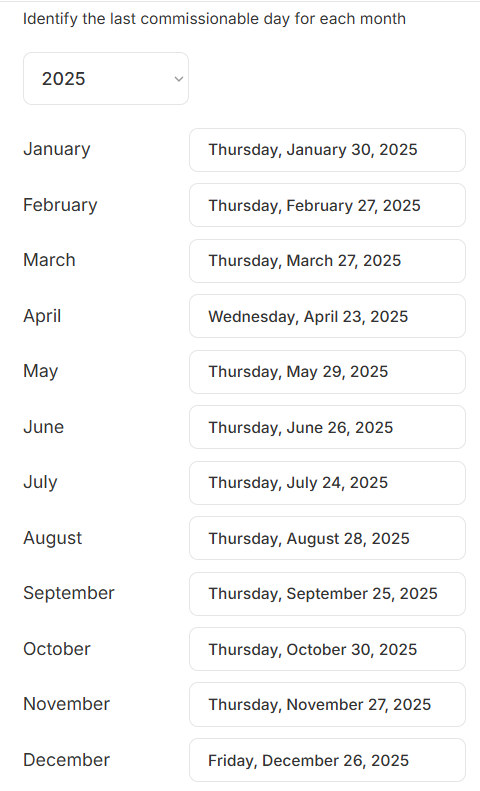
Currently, the user is able to define their ‘last selling day’ for each month using a calendar dropdown and this information is saved in a Data Type where each month corresponds to a different field, numerically identified. See below for input and Data Type:
The problem I’m facing is I’m looking to achieve 2 goals with this.
- The user can qualify each lead into 4 stages of the sale:
- Ask for appointment
- Appointment Scheduled
- Sale in Progress
- Sale Completed
The user can also project when they believe the sale will complete. I’m looking to use the user’s ‘Last Selling Day’ calendar entry and run a workflow on that custom date at 7pm local time to search for all open leads expected to be completed in [current month] but not in [Sale Completed] stage, and toggle a variable which would indicate the sale is overdue. This way, I can notify the user that the sale is overdue, and they can come in the following day and either update the lead to ‘Sale Completed’ or push the expected completed date to a future month. How do I build a backend workflow to accomplish this? I’ve never used a backend workflow aside from the Stripe integration tutorial I followed.
- I’m using ApexCharts to display past completed sales and the user’s future pipeline.

Right now it’s showing the last 3 months, the current month, and the future 3 months. Right now the current month is set as the current CALENDAR month, not the current ‘selling’ month. I’m looking to customize this in a way that changes current month once the calendar date passes the ‘last selling date’.
In the data I’m using for this example, the ‘Last Selling Day’ is 2/27/2025. So what I would like to happen on 2/28/2025 is for the middle data point on the chart to show March, and all of March’s data, with December, January, February as the prior 3 months and April, May, June as the future 3 months. Is there an easy way to accomplish this?
Thank you all in advance for your help, and I’m open to hopping on a video chat if this is too complicated to explain here in the forum.
Raptorflapjacks