Hi,
my app relies heavily on workflow Do every 1 second. For showing countdowns and display/hide groups.
App is managing live video meetings, turning them on/of exact time.
All without page refresh or user click. I do it by date(time) conditions e.g. start date < counter (where counter is dynamic based on states refreshing via do every 1 second).
It all works however with about 16 connected users I see difficulties with personal plan.
App slows down, throws errors “app is too busy” and bubble also sent me email about 20% reaching of my max capacity. I tried to use floppy for offloading database searches and it helped, but still performance issue is there. I tried to use countdown plugins - no help as well to achieve every second dynamic behavior.
Anyone who had similar difficulties and solved them? Crucial for me is to control groups based on time without page refresh by user. Is there any replacement for do every 1 second eg real-time plugins for socket.io?
Thanks.
Pavol
I’m not entirely sure I follow…
What server actions are your Do Every X Seconds workflows making?
Or do you have data sources with constraints based on the updated time?
@adamhholmes I only set bunch of custom states based on current date time. One of them is timer. Every one second is updated custom state current time.
If you display such custom state on page, it shows running clock. Similarly I created countdown. I subtract from End time - Currenttime State (do every 1 second) .
Its a good question what really runs on server except do every one second workflow itself. I do not do any server search.
Here are examples of states I’m setting.


I do have some crazy conditions to show specific groups on time:
What’s ClockConnect? If it’s a plugin does it run as a server side action?
Did you setup the right conditions so your Floppy doesn’t do any searches unnecessarily? For example my Floppies will only update their storage in custom actions that run only when i want it to.
Try checking your logs and see if you can drill down to the actions taking up WU during a session.
@ihsanzainal84 Its just custom state where I set state of current date time in frontend workflow Do every 1 second.
My Floppy runs with Floppy initialized. My floppies sit in hidden group which is loaded with page.
Question is how many times during user session this is running once it is initialized (or after I see data in local storage).
I do simple search like this to build list of dates for floppy:
Yes I keep digging in WU charts. I understand most of them and able to dig down to specific workflow / element / action. For instance I replaced heavy frequent API GET calls with webhooks/POST.
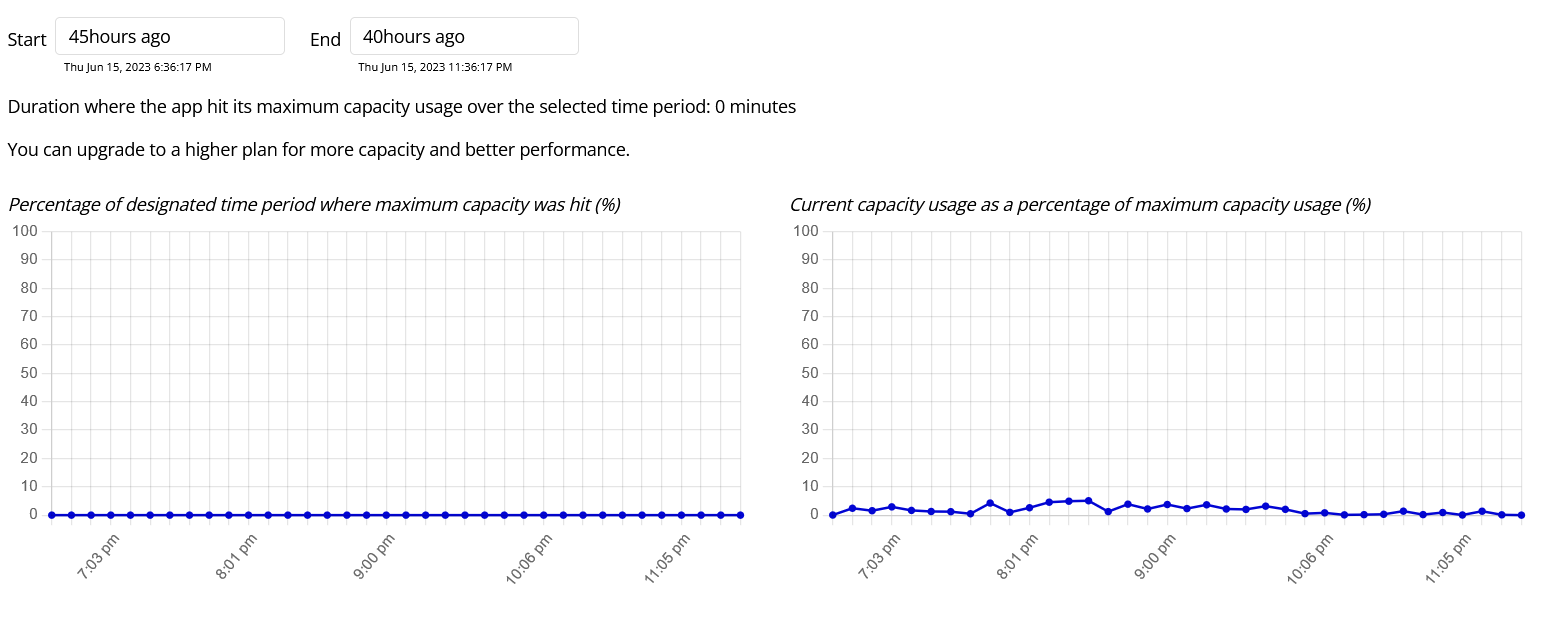
Only what is not clear to me in logs is first two charts
You see on may 25 I had spikes. Around 20%. How do you understand “Percentage of designated time period where maximum capacity was hit”. For me it looked this is just reaching 20% however this caused “app too busy” and “app hanging” for users.
I assume you’re not on a dedicated plan and also not on the new WU plans.
Apps not on dedicated plans share server capacity with every other Bubble app so 20% usage is not 20% of your own maximum but (from what i understand, so someone can correct me if I’m wrong) 20% means you used 20% of the shared capacity of whatever server instance you’re in. 20% is pretty high from my experience.
What do your pie charts say are your biggest offenders of capacity/WU when you drill down? I always check my pies back when i was hitting capacity.
As a side note you don’t really need to hide then show your Floppies on page load. All they do is retrieve from storage (or not) when loaded.
1 Like
Check in the Network tab of your browser dev tools to see if any requests are being made as part of the Do every x seconds workflow.
2 Likes
Hi @ihsanzainal84 ,
you are right Im on legacy personal plan until my app earns for itself  Ok it makes sense although its a bit “blurry” chart
Low WU is very important to me. My app specific use case is 16-30 users connected to app in the same time therefore I need to be very effective.
@adamhholmes thanks for idea will check console.
Hi Performance geeks :),
just want to share my progress. So I made large number of experiments in my app in order to reduce app workload to bubble servers. And it seems I see first signs I succeeded.
If you find yourself facing similar performance issues, you need to consider this
-
Prepare yourself for hours and days if not weeks of digging into your app
-
Make sure you understand bubble charts in logs. What I want to highlight is that you can precisely get back in time and see what happened . In the beginning I did not understand them as they UI is not the best of the class. I mean you need to get used to that you need to type date ranges of charts by hand for some strange reason and you can not use dropdown. However it is small drawback in comparison to advantages of time travel that charts bring.
-
If you are like me on personal plan and in validation phase of MVP, you can’t afford ineffective bubble app and to pay for 4x more expansive next tire. So lets optimize everything.
Focus on areas that you made long time ago and perhaps which were made when you were novice/beginner. It happened to me at least, that I found some really easy to fix ineffective places.
-
If you have many concurrent users in same time, try to spread their actions in time. Ideally there will not be same activity for 10 users in same time. This has something to do with you app specific design - just keep that in mind.
-
Use local storage whenever you can. @keith floppy is just godsend plugin for bubble. Now in fact my app works mostly from local storage of browser and asking on data only when absolutely necessary. This resulted in performance saving and WU decrease.
-
Test with users and iterate regularly. Measure you progress with bubble charts.
Here is what I did
Week 1 - This is my first test - app without any optimization running with 16 users ~40min on personal plan
Week II - I made some great analytics updates adding many API calls and DB operations. This led to big load on buble and users were verz unhappy. App was just not working, frozen or in best case somehow working with errors. This was again 16 users, this time very disappointed.
Week III - I got serious with optimization after user feedback. I killed all unnecessary API calls and used webhooks instead. Still maintaining analytics data but decreasing load. ALso I made many other optimization in old “code”. This time I was one of the 16 users connected when I seen app slowdown when all 16 connected. So there were still problems. I immediately turned on app boost feature and this helped. Users mostly didn’t have performance issues although charts still show high load.
Week IV - I got reply from bubble’s support where I could do more optimization. They just pointed out what I seen in charts before. This led me to use even more Floppy data storage than before. In this point app asks for data very rare and preloads data to individual users before there is peak. Similarly all activities were splitted in time so that there is no peak when multiple users “exhaust” server. Now this was my first test after huge refactoring of app and only with 10 users. However charts speak for itself. No performance exceeded, no need to boost. It seems personal plan will be usable for some more time. There are some more optimizations to do, perhaps I will post later.
Overall I wish you patience with performance optimization. It pays off. BTW if you also like @keith plugins perhaps you noticed there are some bubble nominations for top bubblers :)! Its clear where went mine.
Pavol
5 Likes