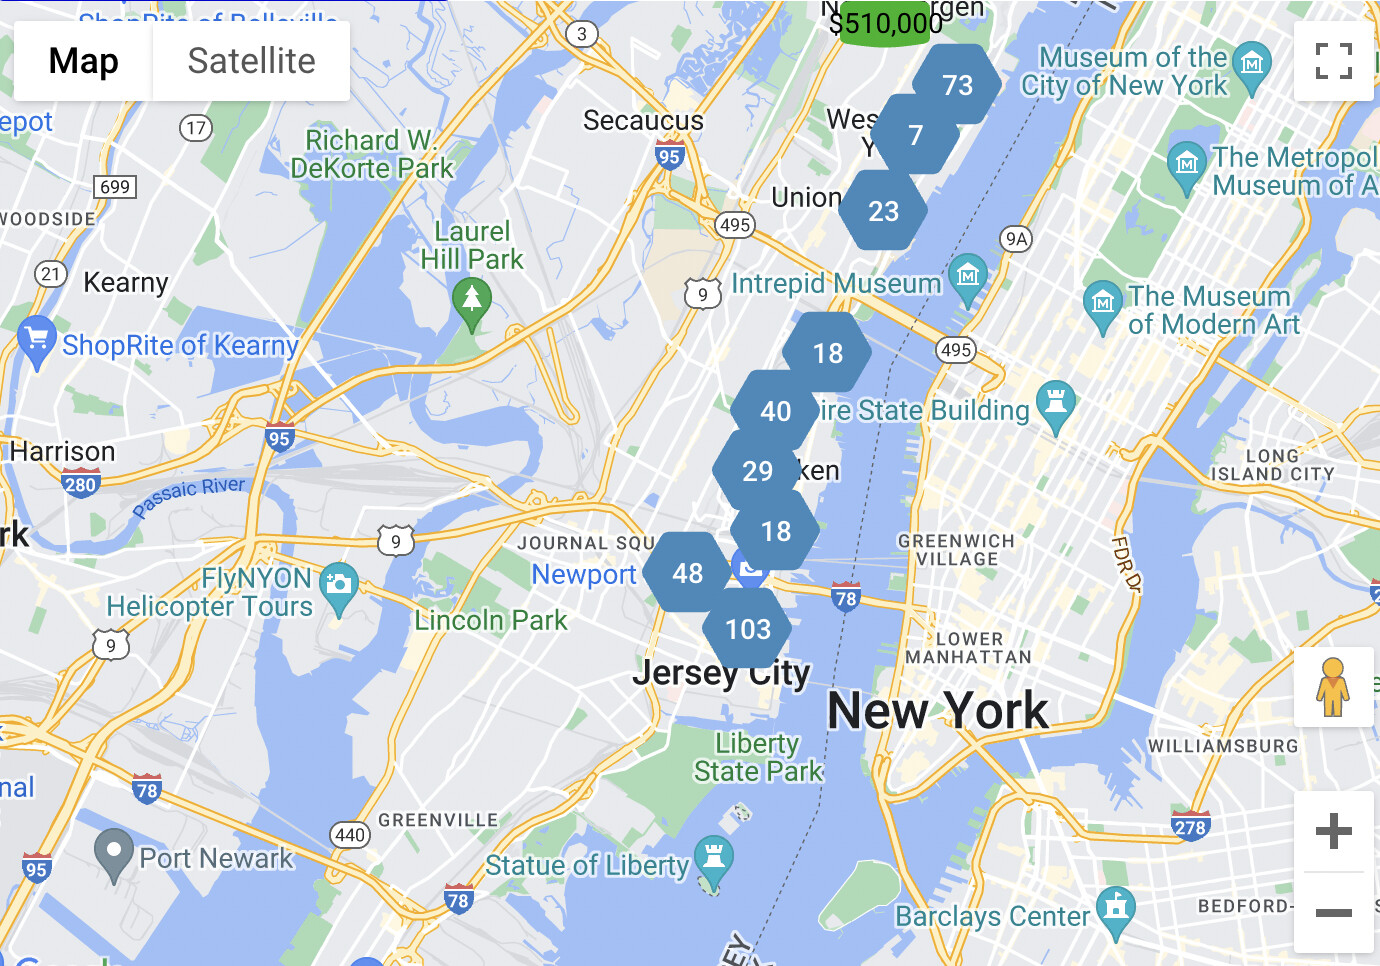
I would like to display addresses only within a polygon boundary and can’t get the “Google Maps-Contains Location” action to work. Please see the map below with showing a neighborhood with boundaries (polygon)
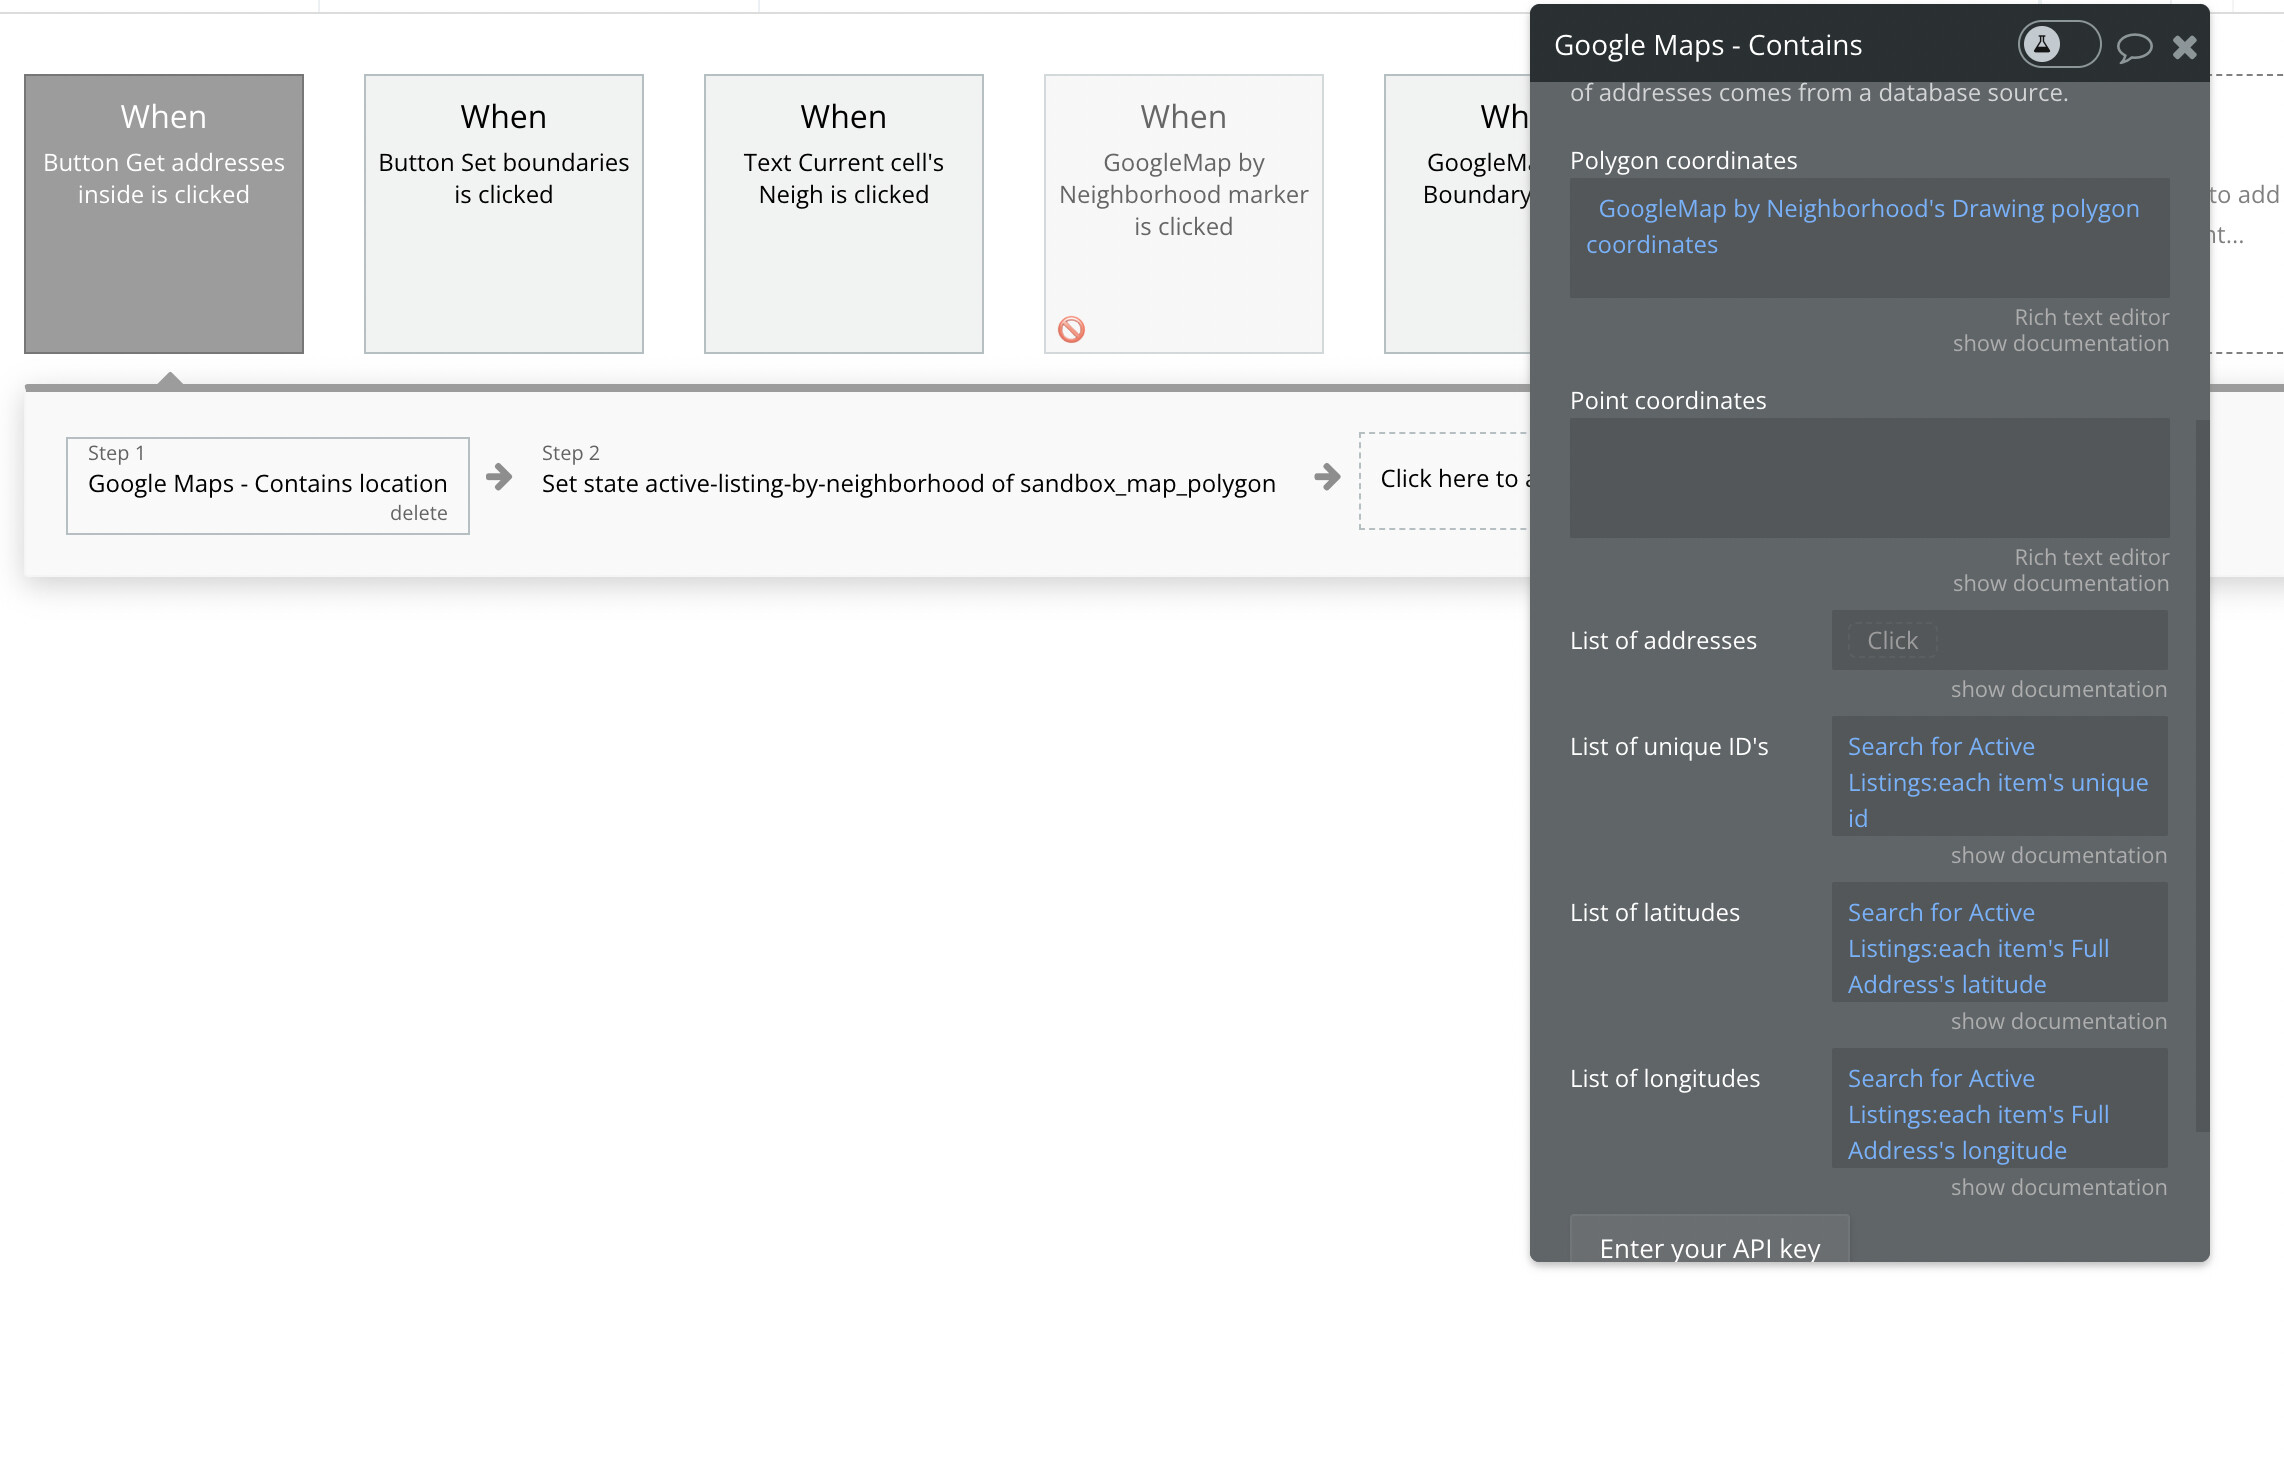
All the properties from my database are currently being shown on the map. When I click the " Get addresses inside polygon" button I am running the workflow seen below
It’s ok, there’s a lot of things going on inside this plugin and sometimes more than one way to do what you want.
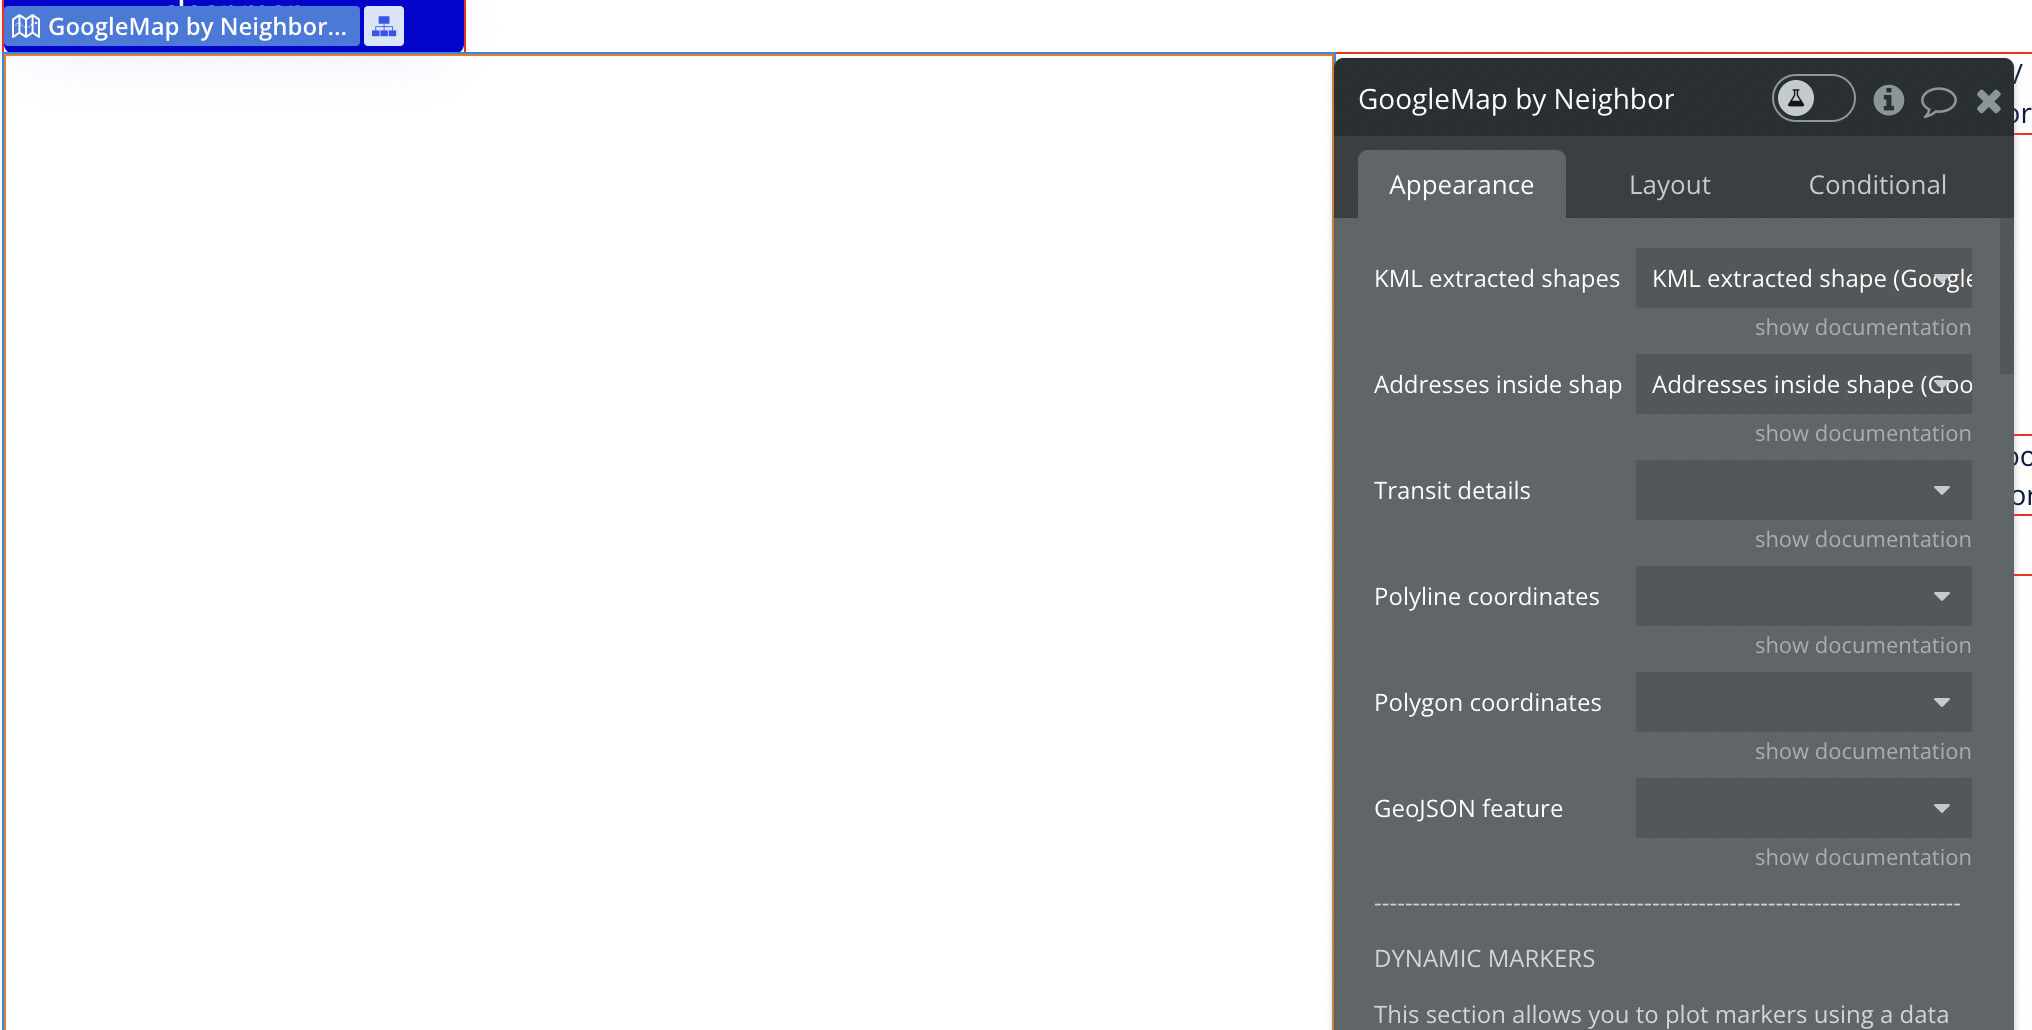
The easiest way to do this is to make use of the Get viewports action. You can run that and pass a Shape ID into it, then it will populate a state called “Shape viewport”. When you then run the Set list of markers you can make use of the field called “Viewport (custom)” and pass the state directly into it. Or you can use the “Shape coordinates” option directly below that to feed in the coordinates for the shape (if you use that, you don’t need to run the Get viewports action).
When the markers are added, only the ones which fall inside the shape’s viewport, will be made visible. It’s probably a little easier to set it up this way than to use the Contains Location action, since it’s little more fiddly to get working.
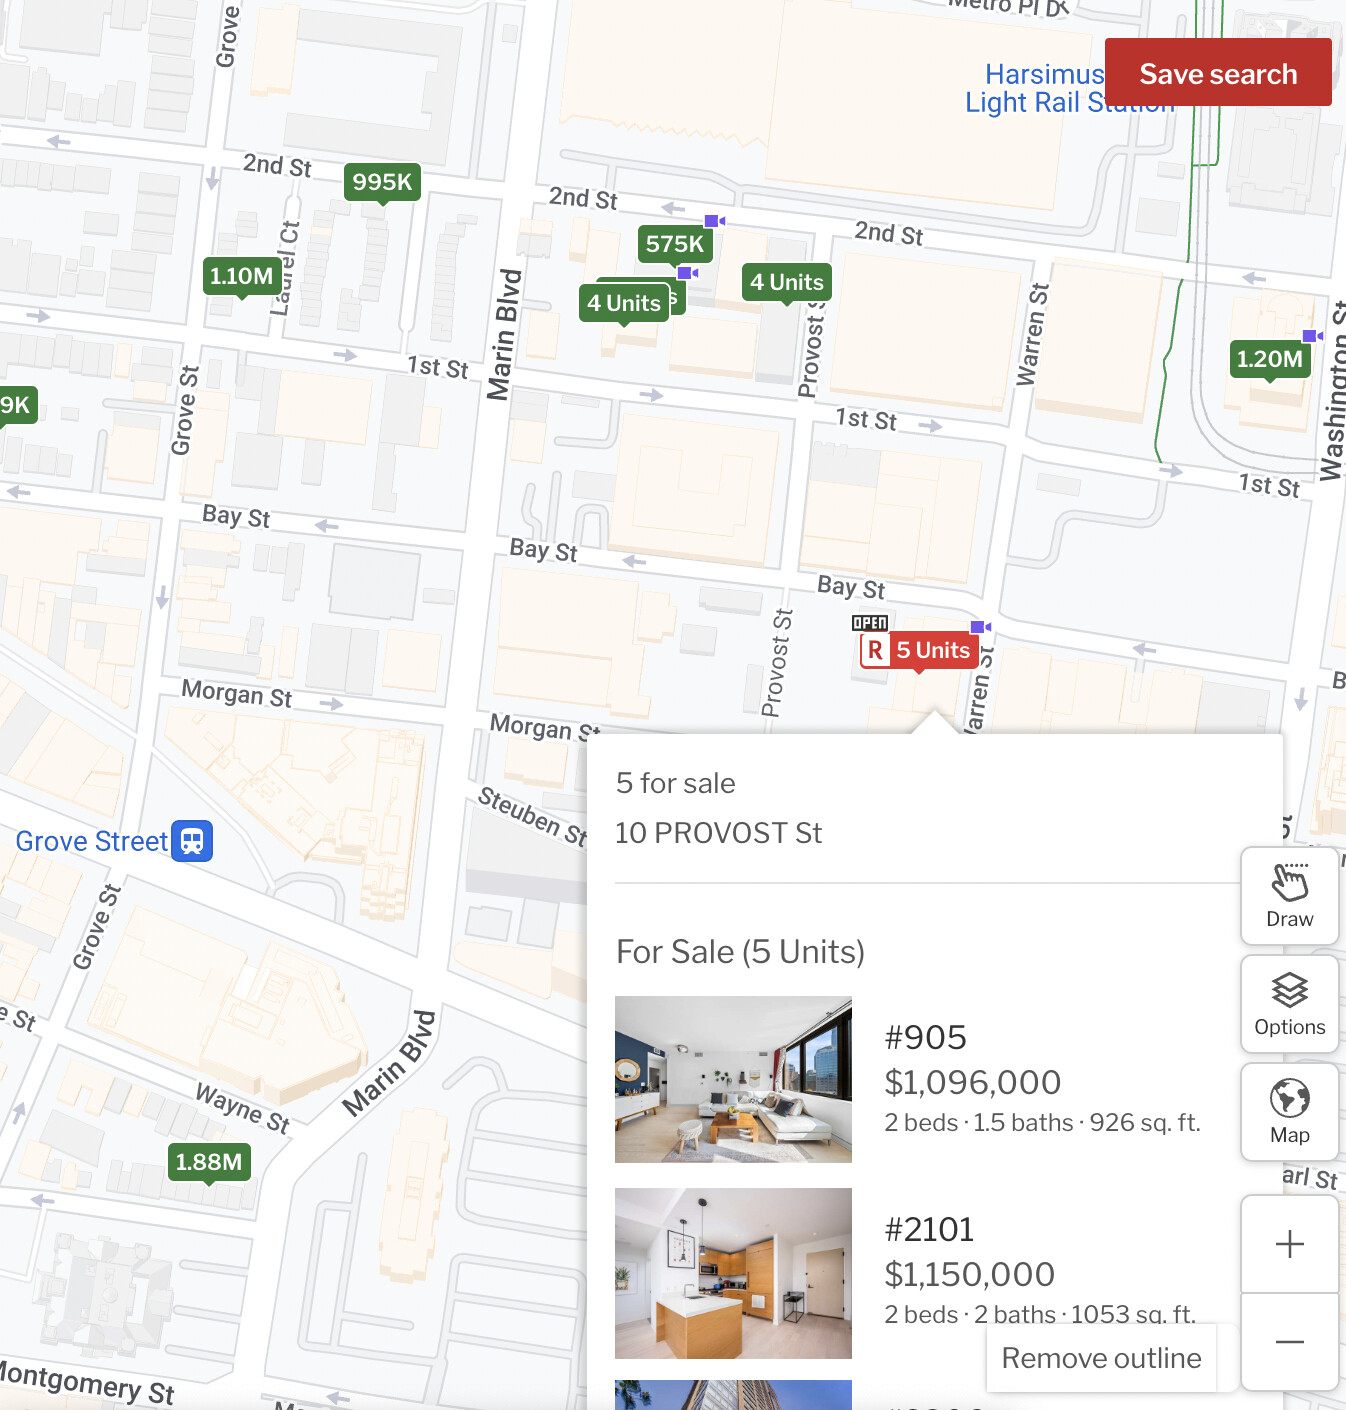
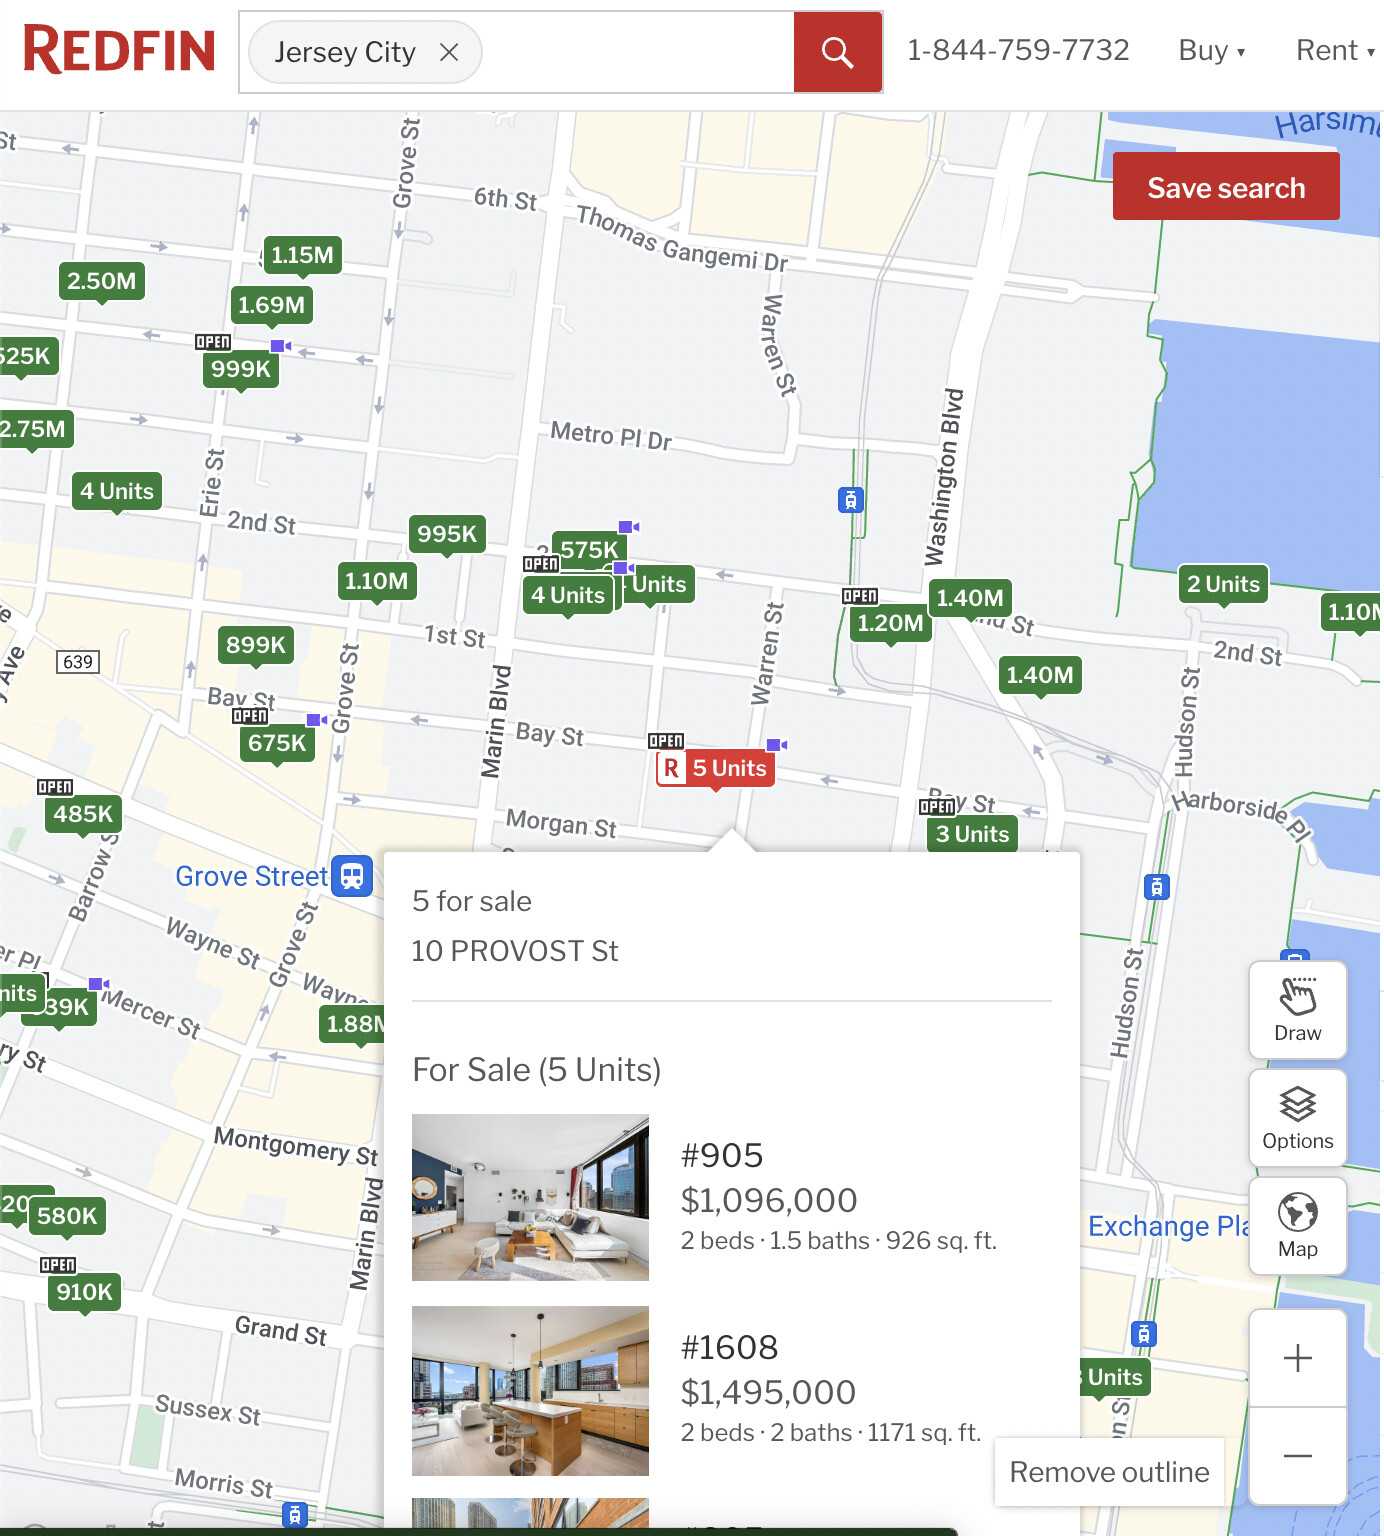
Some addresses could have multiple entries - so how can I group all addresses to show # of instances as the market and upon clicking I want to display all available options under that address - see below screenshots
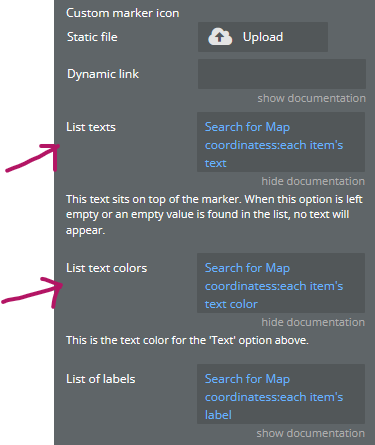
For the dynamic data, I’d have to add options into the plugin for the markers that allow for text/color to be added. I can do this but it’s going to require an update and a bit of work.
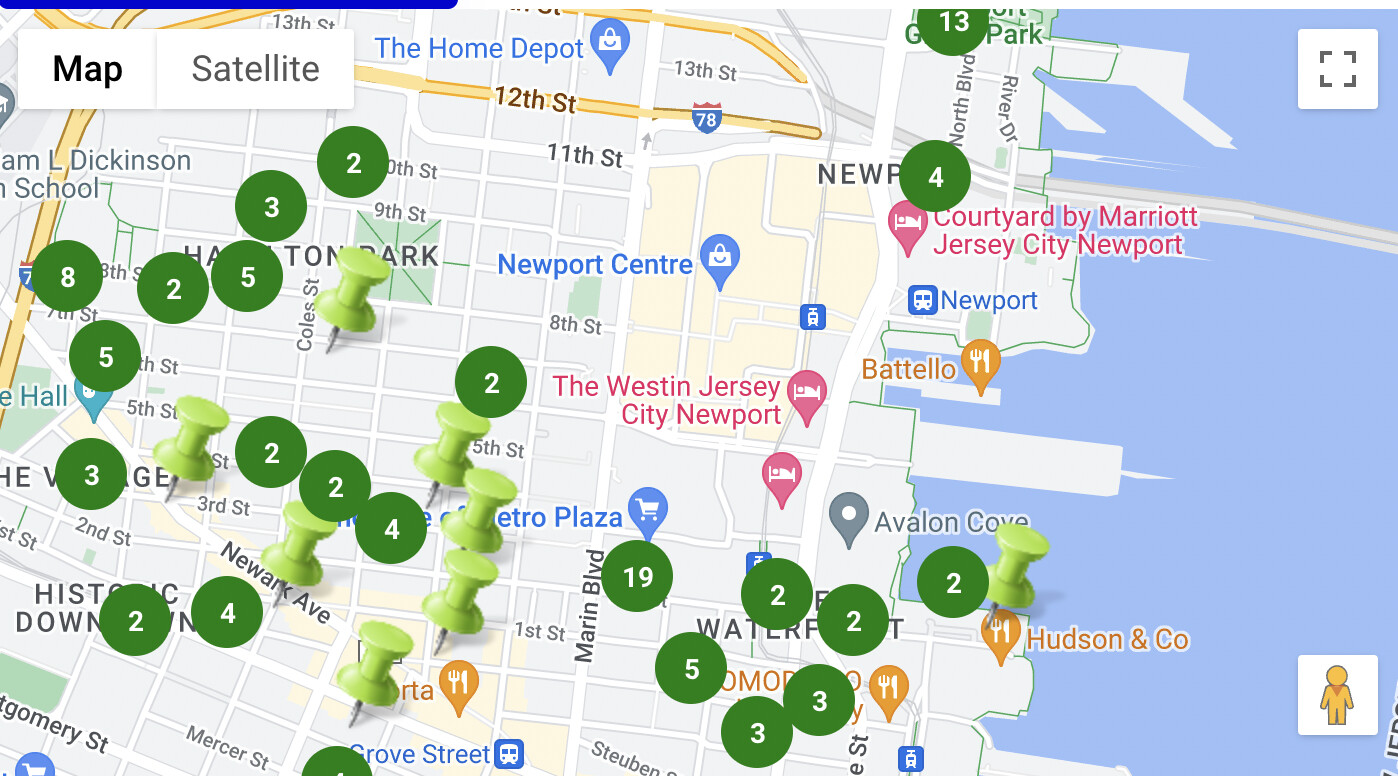
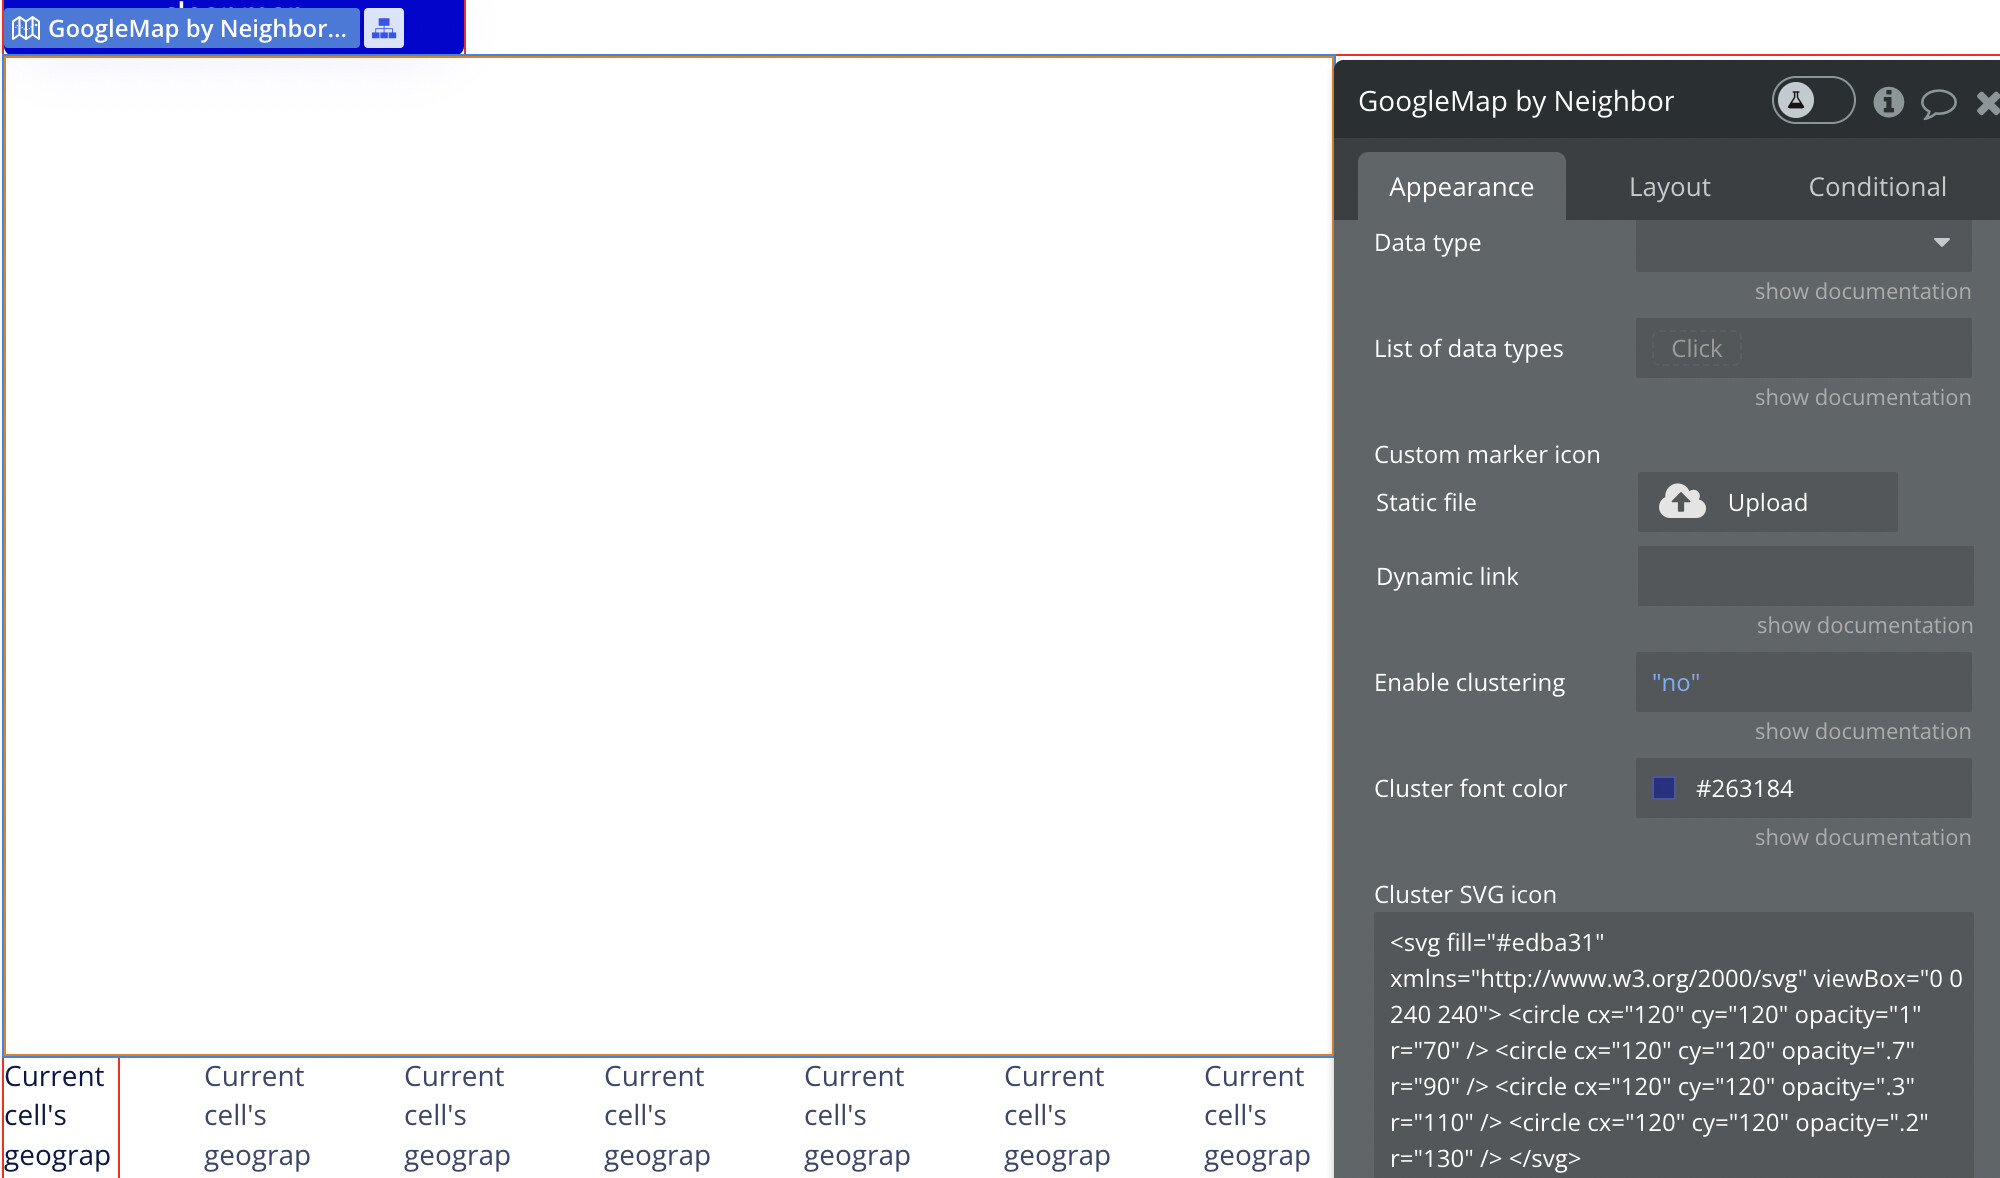
This level of customization with regards to grouping may require some additional work to. The best you can do at the moment is to use the clustering feature and specify your own SVG image to replace the default circle one that appears with the number inside it.
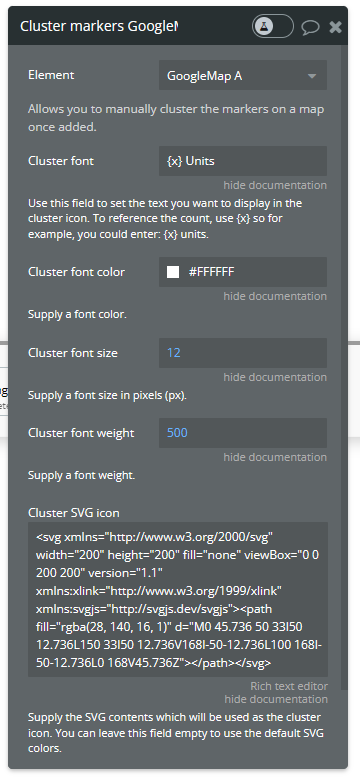
Instead of using the dynamic marker options within the main map’s plugin element to add your markers, instead make use of the “Set list of markers” action. Make sure you run that action inside the “is ready” event. When it’s complete, it will trigger the “finished loading a list of markers” event and inside that you can run the “Cluster markers” action. When you run that, you’ll be able to specify an SVG as shown.
Be sure to use the events correctly as I’ve mentioned, this will ensure the actions are run in the correct sequence and you don’t run into problems. The SVG you’ll have to figure out, you need to make it look like your green units image without the text. Right now, it will only show a number (so no text) I could tweak the action allowing text to appended to the number if you get this far.
@pork1977gm if you need even the slightest bit of inspiration to develop the functionality to set custom text/color per pin based on datapoints on the record please send me a DM - I would be happy to sponsor development of this feature!
Greetings, @pork1977gm
Thanks for the plugin, it has a lot of useful functionality. I encountered a number of problems during development. I hope you can help me with it.
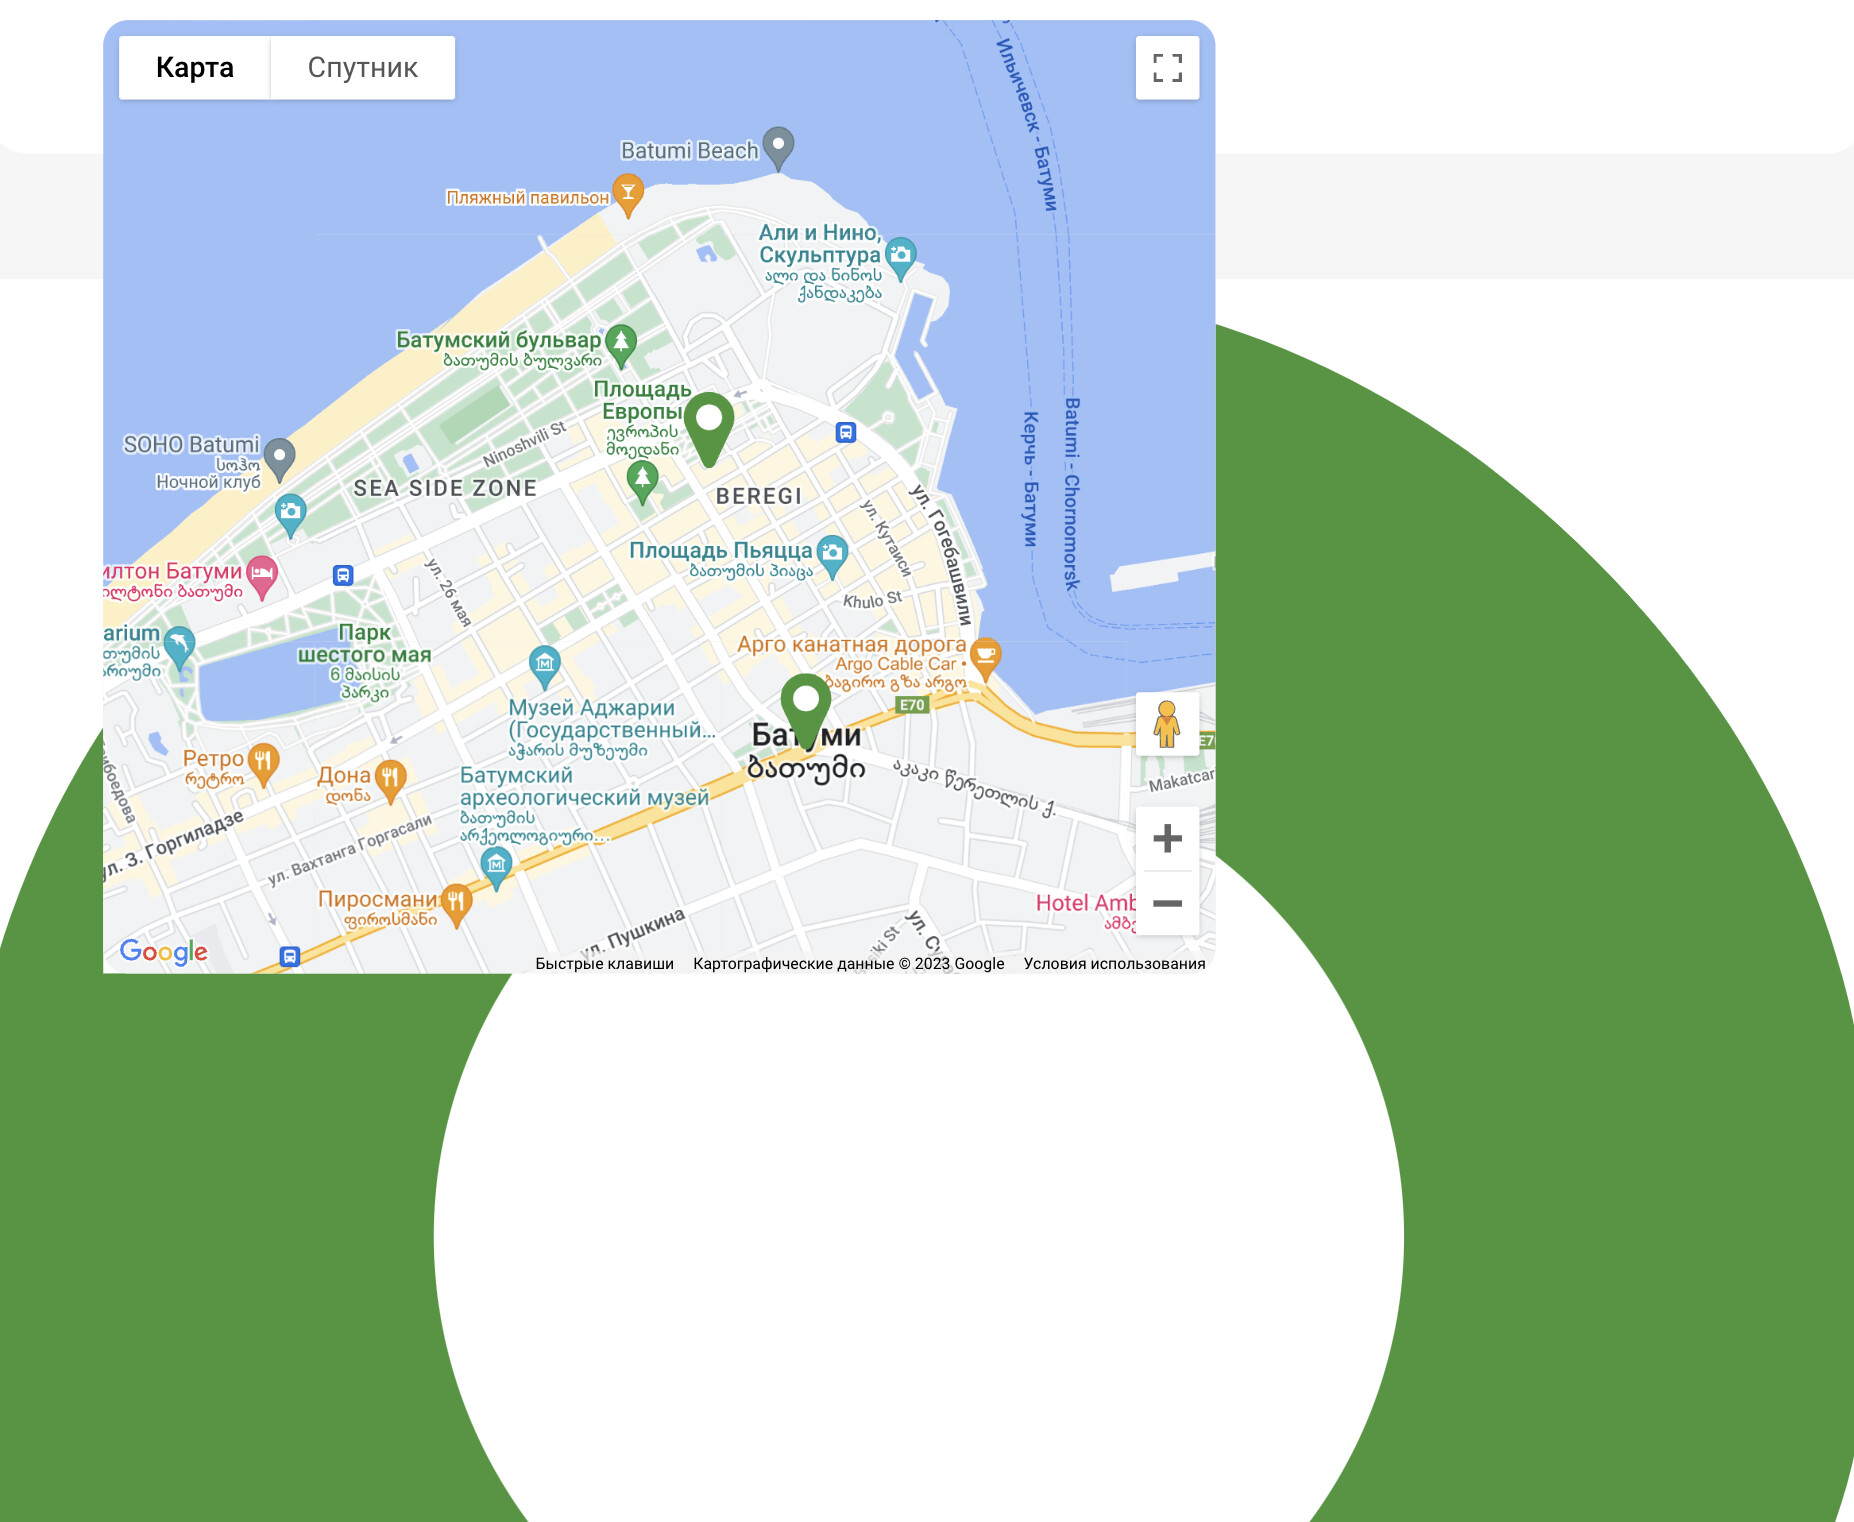
After I added an item to my page, a huge marker icon that I set for objects appeared under it (see screenshot below). Can you tell me how to remove it?
I have a repeating group where I display all objects on the map (markers). Is it possible to display in it only those objects that the user sees on the map at the moment? And that the list of objects changes depending on what part of the map the user is on?
Thanks in advance for your support and have a great day!
Thanks Paul I was able to follow your instructions to customize the clustering - see below.
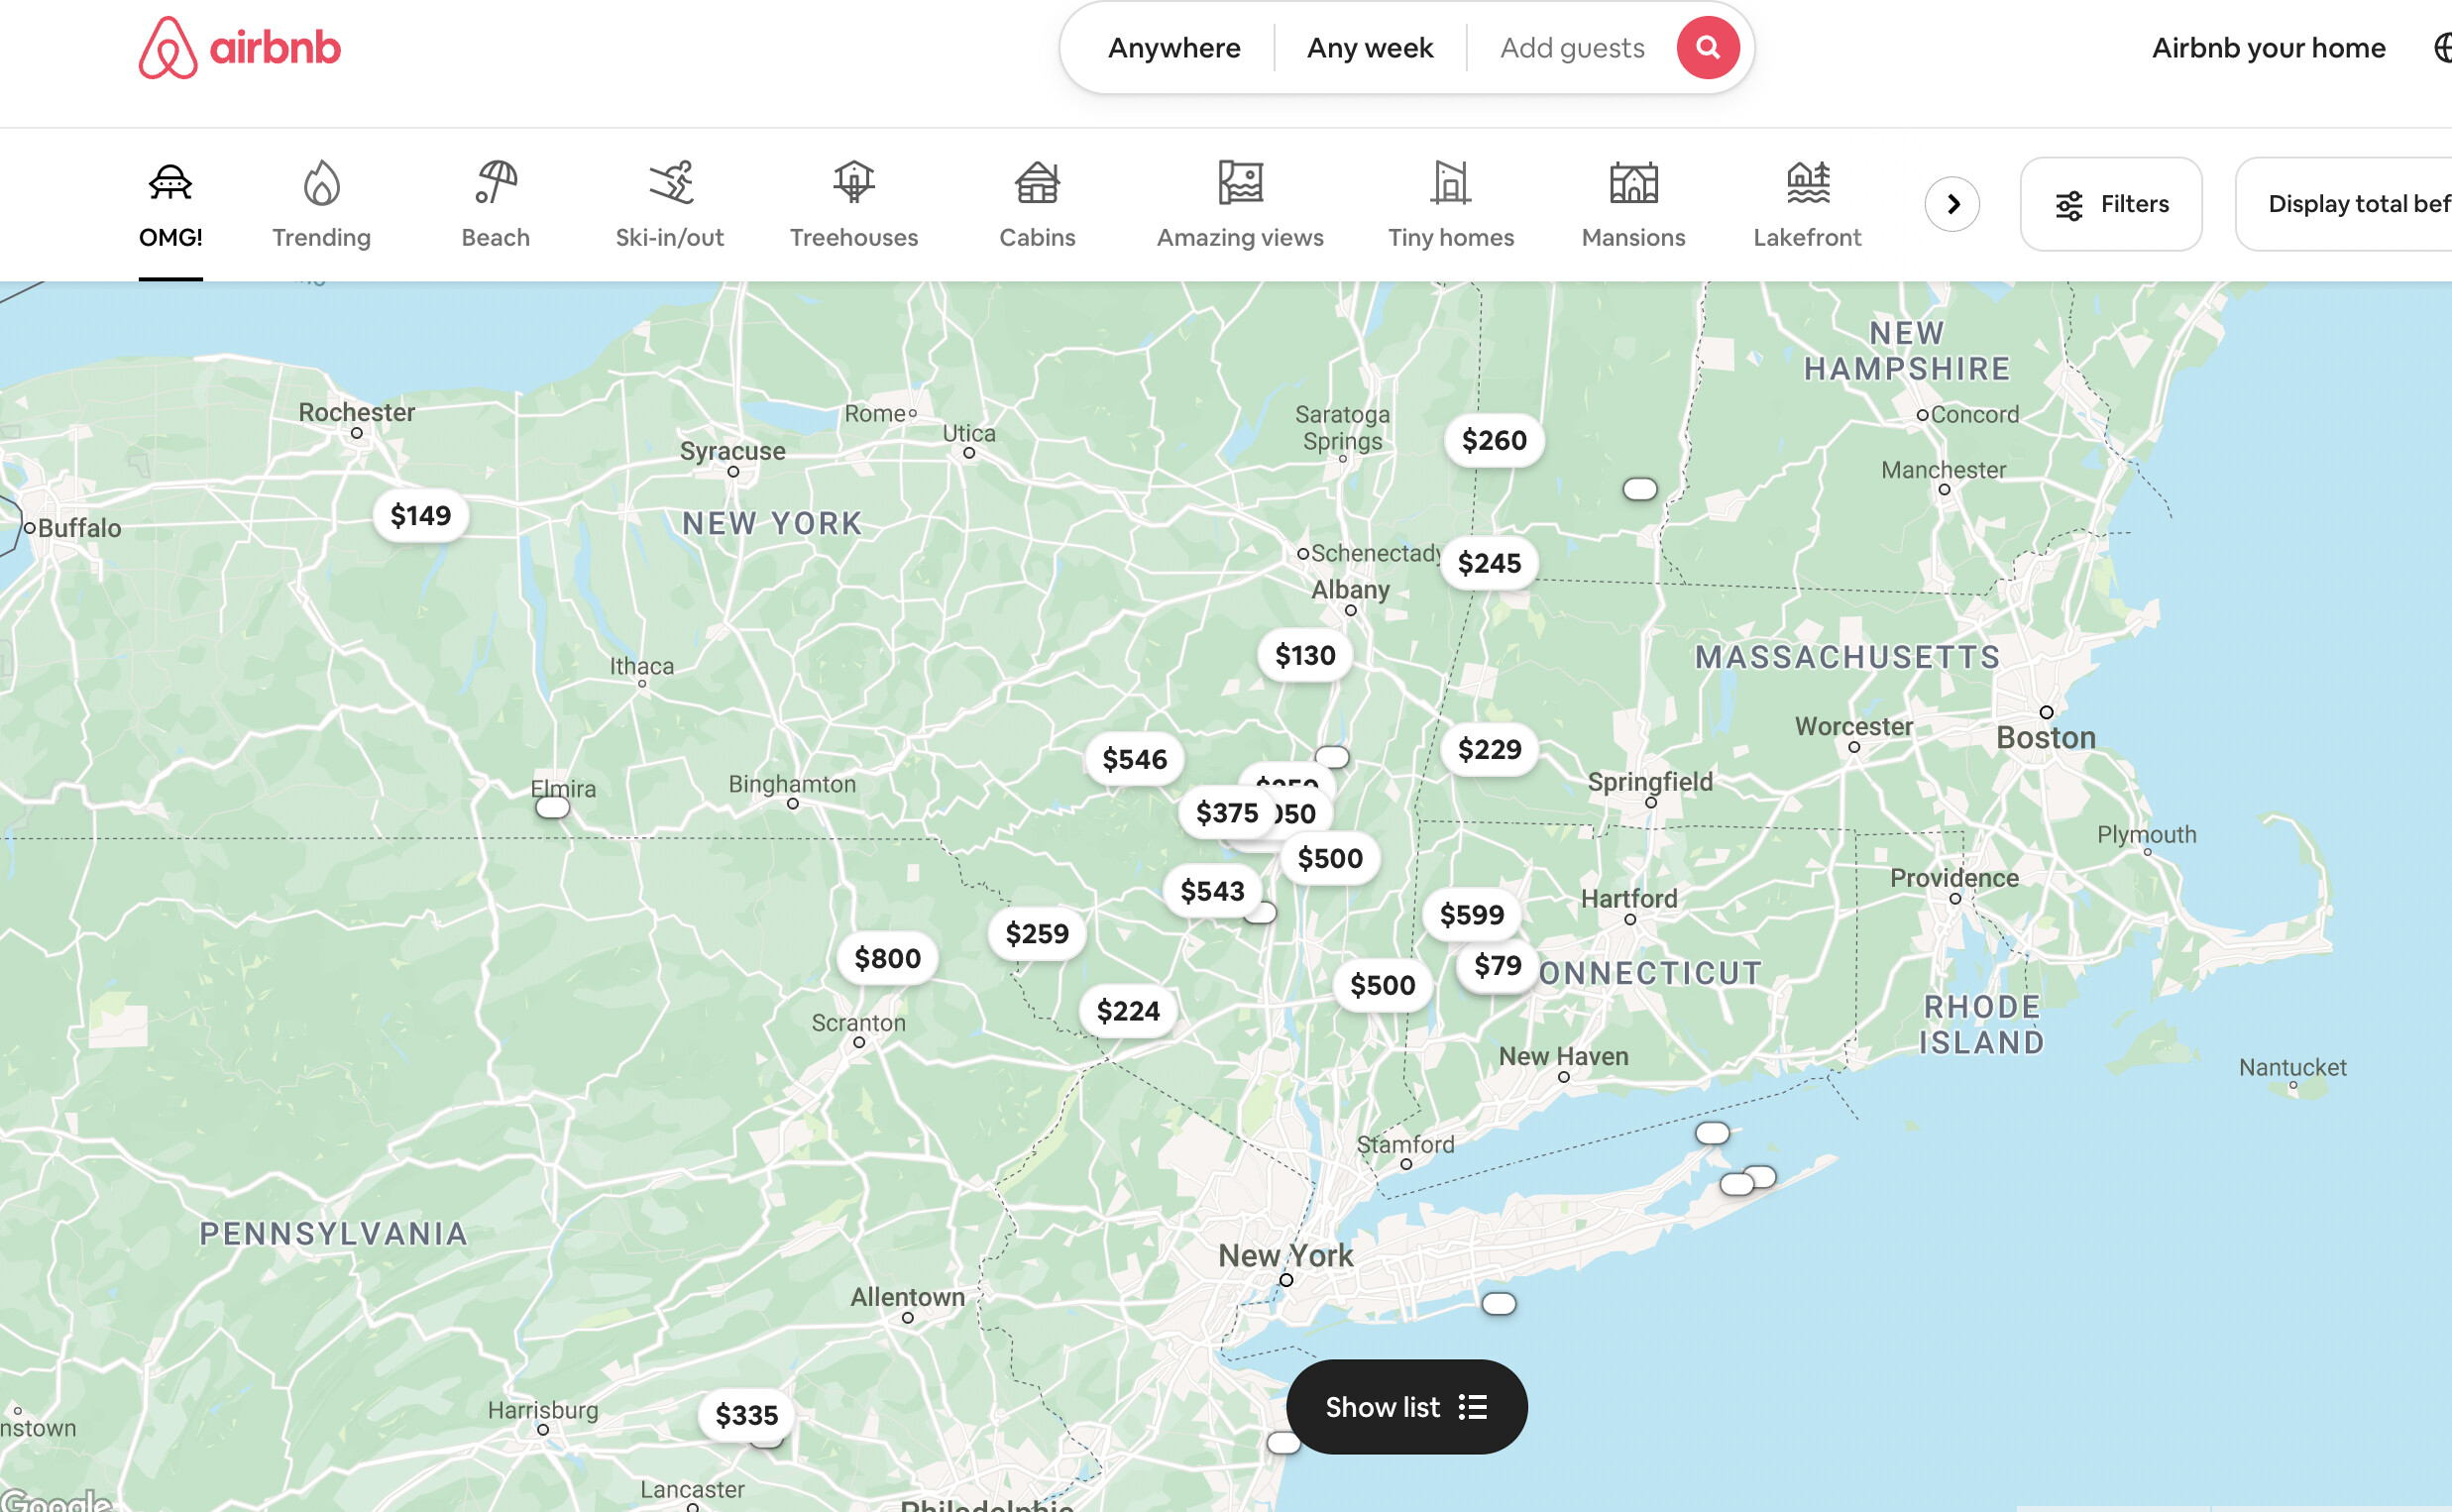
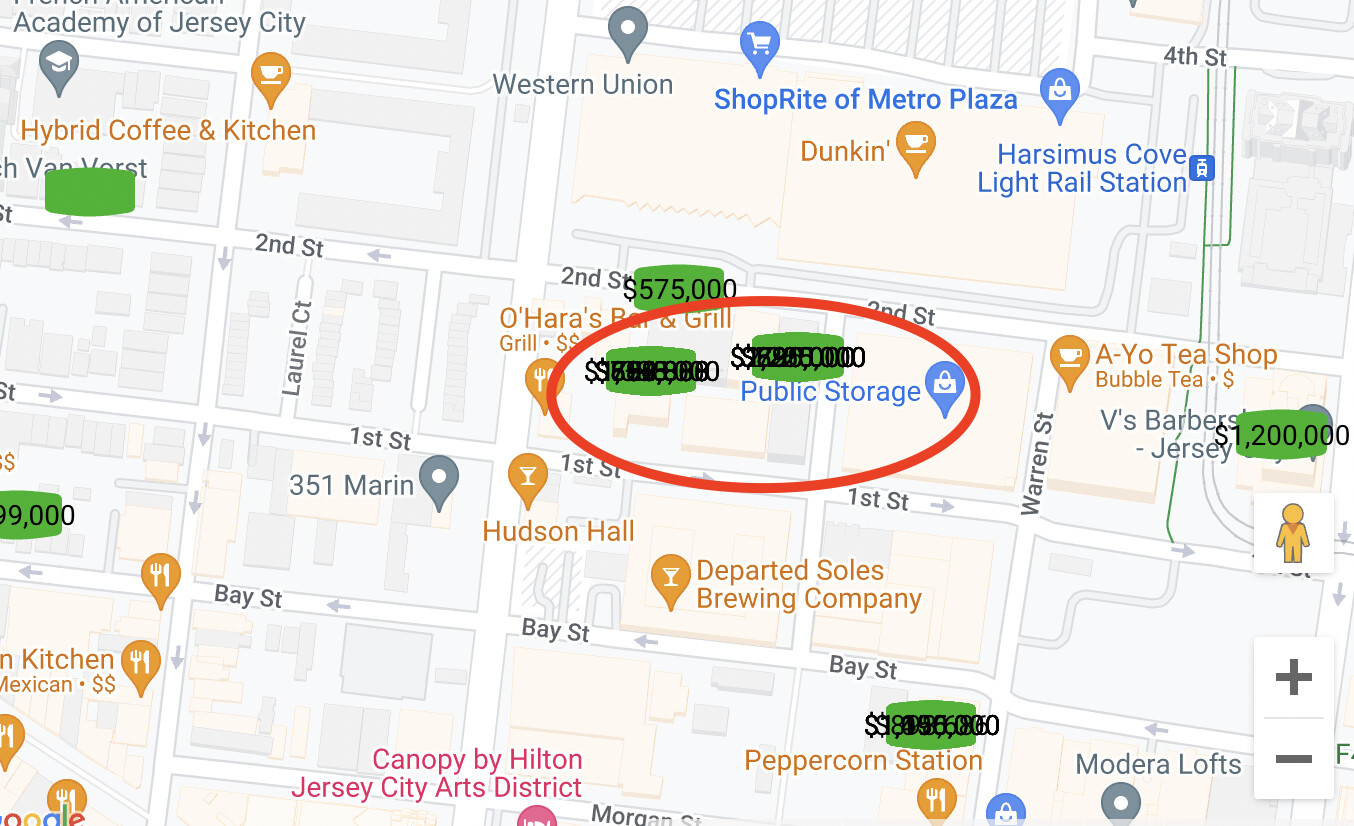
However what I am looking for is the ability to show dynamic data for each marker - in my case, I am designing an app for showing properties for sale and I would like to show the purchase price as the marker - inside a green rectangle (like Airbnb map see below)
Additionally, for my app, there will a building (one address) with several units for sale - for example 123 Main will have Units 1, 2, 3 for sale - for this instance I would like to show 3 units as the marker and upon clicking this marker I can show a popup with dynamic list of the 3 units for sale.
I’ll get back to you all soon, very busy working on jobs etc at the moment but I will get these issues fixed for you all, just need some time.
@kash1 that type of popup needs to be written in the popup field as HTML and then you pass dynamic data into it. When I get around to looking at these jobs, I’ll do you an example.
Are you able to provide me with a URL where this huge icon is appearing? I’ve not seen it happen before but I’m curious as to what’s causing it, it shouldn’t happen. I could do with a screenshot showing the order of actions/workflows which are running to.
There is no event which triggers after removing a shape at the moment but I will add one for a marker and one for a shape which trigger when the ‘Remove marker/shape’ action runs.
All markers added are added to an internal array which I don’t publish as an exposed state right now. I can do it but it’s a little tricky because of the structure of it. To do what you want for this last section will require a bit of work. Could you do something similar but through the use of triggering a custom workflow where you have input parameters setup for it? You might have a “type” option set defined that contains 3 things (added, deleted, updated) and depending on that value passed into the custom workflow, specific actions would conditionally run to keep track of things. That way you can just trigger it every time a marker is added/removed/changed and the actions inside the event take care of the rest.
@kash1@tchristian
Your changes are complete. I haven’t pushed the update yet but if you go to the demo site and hit the red “Add this list of markers to the map” you’ll see 5 markers added with text labels and a custom clustering icon appear.
I’ll write up the updates later including the actions that have been changed.
Events - ‘marker has been removed’ AND ‘shape has been removed’ added. These events trigger when a marker or shape has been removed from the map when using the 'Remove marker/shape' action. They will also trigger once when a list is used.
Set marker
Set list of markers
Change marker properties
Cluster markers
Everything changed and all documentation fields updated.
Great, glad to hear it! I’ve only added the text and color at the moment, I probably should have included size and weight options also. If you end up needing those then let me know.
Is there a way to set the dynamic text font color - by using a hex code like you provided an option in the cluster markers - cluster font color? I would like to set the font to white but I don’t understand why the only option is to set the font by fetching a list of texts
Conditional Formatting the dynamic text - for example show $590,000 as $590K and $1,100,000 as $1.10M
A single address with multiple units doesn’t show as a cluster - instead the dynamic text overlaps each other - see below - I would like to show markers with the same address as a cluster - and thereby set it under cluster font as {x} units
Can you show me how you’re setting the markers on the map because there’s at least 3 different ways. Fire me a load of screenshots over and tomorrow morning I’ll work on it.
Note: Addresses are being pulled from Data Type - “Active Listings”. Some addresses have multiple entries - for example - 123 Main Street might have 4 entries in Active Listings because 123 Main street will have 4 different units available for sale within that 1 building/1 address. Therefore in that instance your clustering option doesn’t work and you can see that the dynamic text for each entry overlap - as I previously shared.
Yeah, sure, here’s the link: Real estate Georgia
If you scroll all the way down the page, you’ll see a huge icon that I’ve designated as my marker.
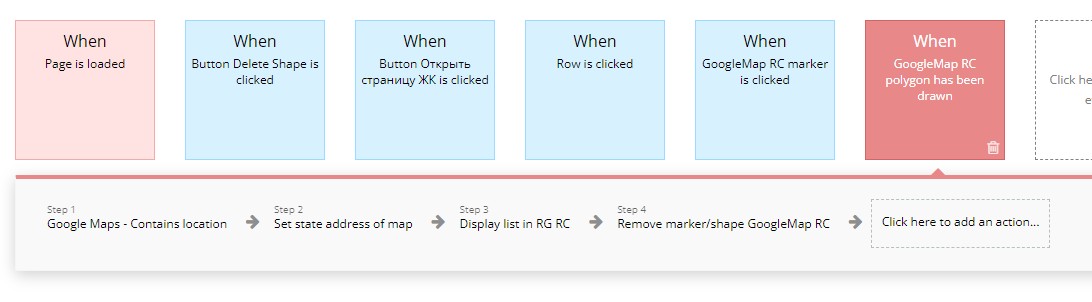
Also, here are screenshots of my workflows on this page:
Can you put 2 repeating groups on a page and for each data source, use those 2 lists then send me a screenshot. I can’t visualize the structure very well. The 2 lists need to have the same item count and each item represent the same row of data.
How it works is like this…
It uses the main address list (say we have 10 items) and it obviously iterates through each of those 10 items. Each time it does that, it uses the item count, as a reference for all other lists to get it’s data. So by that, I mean if it’s at 5th iteration (item 5) then it will reference item 5 in all the other lists. Item 5 in this example of the address will need to match item 5 of the list price.
Ok, couple of things which may help here. Move the “enable drawing tools” action from the page is loaded event to the “is ready” event.
To delete a polygon, you can run the “Remove marker/shape” action and pass in the correct shape ID. When the shape is removed, it will trigger the “shape has been removed” event.
I’m pretty busy with jobs at the moment, I have more than I can chew on to be honest, but if you’re changes are simple and not too tricky then I’ll try and help. Fire them over to me in a PM and I’ll have a read.