Hi all,
Another new plugin available! this one is all about performance data, what you can do with it and how you can use it to determine areas of your site that might be slowing things down, or just because you’re interested in the data.
It focuses on a few things, the performance timing metrics which come directly from the browser, the ability to monitor workflow response times and it is able to setup a service worker which can cache all pages, images, links, css etc and improve page loading times. If this is a feature you want, then let me know and I can send over the service-worker.js file designed to be used with this.
PLUGIN
https://bubble.io/plugin/performance-timing-1631381229197x329933070800257000
DEMO
https://paul-testing-4.bubbleapps.io/performance
Some of the details within this post are somewhat on the advanced side so I shall do my best to break things down, but I have touched on the more technical aspects of things in order to try and cover everything which this plugin is all about. It gets more in depth the further you read!
The plugin itself takes care of all the calculations which report the data so all you have to do is access the exposed states, then you’ll be able to generate things like this…

You can report on a number of resources like Page loading speeds, Event loading times, DOM loading times, Domain lookup times, Network latency etc. It also supports some of the more advanced core web vitals statistics such as:
- First Contentful Paint (FCP)
- Largest Contentful Paint (LCP)
- Time To First Byte (TTFB)
- First Input Delay (FID)
- Cumulative Layout Shift (CLS)
These are often used by various search engines (like Google) to improve search rankings but the data may not necessarily be available in all browsers or reported on first load. For example, the First Input Delay metric will populate when the page is first interacted with. This could be from the click of a button or some other type of page interaction. These are explained in more detail at the bottom of this post under the WEB VITALS section.
It also offers a way where you can mark the start and end points of a workflow and report back the total workflow execution time (in milliseconds). You can then capture the response times from the entire workflow to determine which ones are performing the worst overall. You could set a threshold using the states called Mark duration and Mark average to inform you when a workflow might be taking longer than normal (if you wanted that level of measurement).

For documentation purposes (and my own sanity) this post will outline everything.
ELEMENTS
Performance
This visual element needs to placed onto your page and the options filled as shown below.

EVENTS
-
A Performance start mark has been set
Event triggered when the 'Start mark' action has completed running. -
A Performance end mark has been set
Event triggered when the 'End mark' action has completed running.
ACTIONS
-
Start mark
This action creates a ‘start’ mark which can be used to measure performance. -
End mark
This action creates an ‘end’ mark which can be used to measure performance. -
Convert time to date
Use this to convert either an epoch or a high resolution time to a readable date format.
-Time
Enter an epoch or high resolution (HR) time stamp (ms) to convert to a readable date time.
EXPOSED STATES
- Navigation timing
This is an object type of exposed state which contains all the available entries returned from the Navigation Timing API.
NOTE: There are 2 versions of this API (Level 1 and Level 2) which can affect the times seen in the majority of the number fields outlined below. For browsers which support the Level 2 spec (most of them) the times represent a high resolution time stamp (in milliseconds). If you happen to use a browser which doesn't fully support the Level 2 spec (mainly Safari) then the times are represented as a 13 digit EPOCH time (in milliseconds). More information can be found further down in the TIME STAMPS section regarding exactly what these mean. Both of these can be used to generate a full date using the 'Convert time to date action' if needed.
| Performance A’s Navigation timing… | 's domainName | text |
| 's entryType | text | |
| 's startTime | number | |
| 's duration | number | |
| 's initiatorType | text | |
| 's nextHopProtocol | text | |
| 's workerStart | number | |
| 's redirectStart | number | |
| 's redirectEnd | number | |
| 's fetchStart | number | |
| 's domainLookupStart | number | |
| 's domainLookupEnd | number | |
| 's connectStart | number | |
| 's connectEnd | number | |
| 's secureConnectionStart | number | |
| 's requestStart | number | |
| 's responseStart | number | |
| 's responseEnd | number | |
| 's transferSize | number | |
| 's encodedBodySize | number | |
| 's decodedBodySize | number | |
| 's unloadEventStart | number | |
| 's unloadEventEnd | number | |
| 's domInteractive | number | |
| 's domContentLoadedEventStart | number | |
| 's domContentLoadedEventEnd | number | |
| 's domComplete | number | |
| 's loadEventStart | number | |
| 's loadEventEnd | number | |
| 's type | text | |
| 's redirectCount | number |
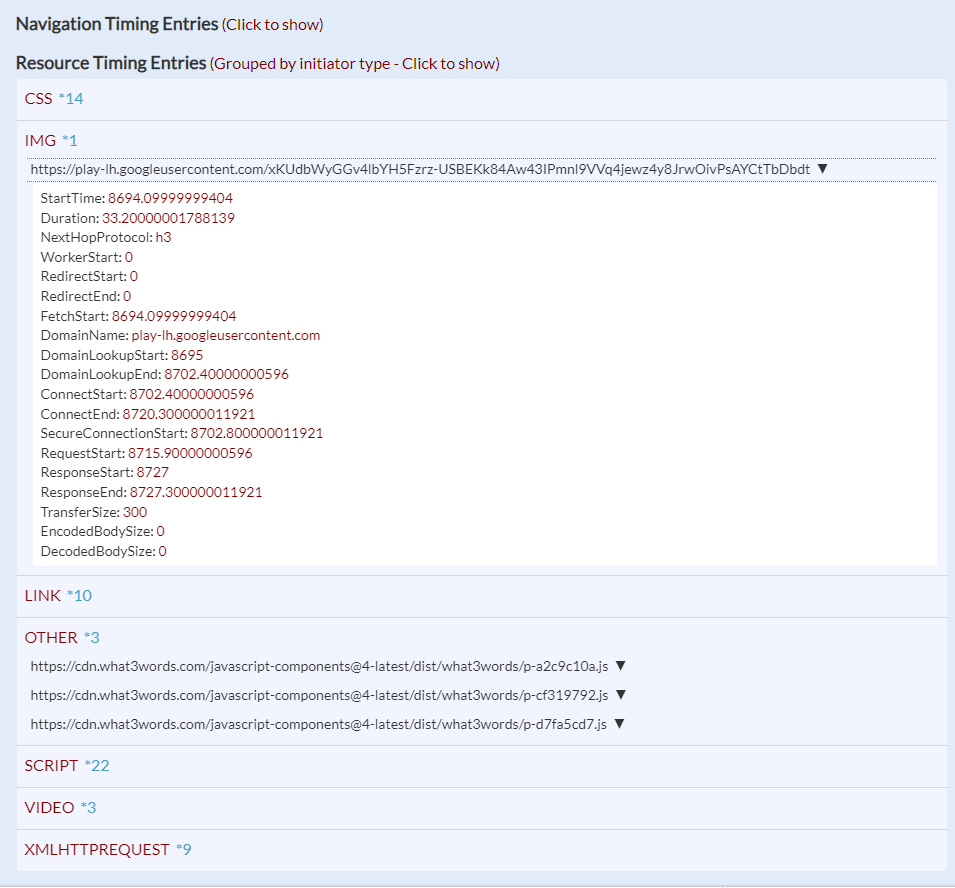
- Resource timing
This is also an object type of exposed state which contains all the available entries returned from the Resource Timing API. It is a List of all the various resource types being loaded on a page such as CSS, SCRIPTS, IMAGES, VIDEOS, LINKS etc and can be referenced by the entryType field. Each resource type (entryType) will show the following fields.
NOTE: The same note which applies to the Navigation Timing API above also applies here.
| Performance A’s Resource timing… | 's name | text |
| 's domainName | text | |
| 's entryType | text | |
| 's startTime | number | |
| 's duration | number | |
| 's initiatorType | text | |
| 's nextHopProtocol | text | |
| 's workerStart | number | |
| 's redirectStart | number | |
| 's redirectEnd | number | |
| 's fetchStart | number | |
| 's domainLookupStart | number | |
| 's domainLookupEnd | number | |
| 's connectStart | number | |
| 's connectEnd | number | |
| 's secureConnectionStart | number | |
| 's requestStart | number | |
| 's responseStart | number | |
| 's responseEnd | number | |
| 's transferSize | number | |
| 's encodedBodySize | number | |
| 's decodedBodySize | number |
Example of data returned.
-
Is loading
Shows Yes on first load then shows No when all performance entries are available/ready to be retrieved. You should always wait on this state becoming No before working with any of the data. It normally takes a second or two but never holds up any other actions on the page. -
Mark duration
Duration (in milliseconds) between the start and end mark actions. It is updated every time the ‘End mark’ action is run. -
Mark average
Average mark response time (in milliseconds). It is updated every time the ‘End mark’ action is run and can be used to give an indication of average workflow response times. The average value seen here is based on all mark durations that are accumulated. -
Converted time
Date which is populated upon running the ‘Convert time to date’ action. -
First contentful paint
Start time at which the first bit of content is painted into the browser. This is something which is defined in the DOM such as text, image, video or canvas render. Further information on how this works can be seen further down this page. -
Page load time
Page load time for the current page URL. -
Page render time
Total time taken to render the current page, also known as DOM processing time. -
Network latency
General indication of network latency for the current page URL. -
Navigation type
How the current page was navigated to, values can be navigate, reload, back_forward or prerender. -
Page download time
Transfer/page download time for the current page URL. -
Request time
Request time for the current page URL. -
Domain lookup time
Domain lookup time for the current page URL. This value can be 0 if the browser has already cached the domain name. -
HTTP header size
HTTP header size (in bytes), if the browser supports this. -
Server connection time
Time taken to connect to the current page URL. -
Time to first byte
Time is takes for the browser to load the first byte of information. Further information on how this works can be seen further down this page. -
Cumulative layout shift score
Cumulative layout shift score which is subject to change dynamically. Further information on how this works can be seen further down this page. -
First input delay
Time it takes for the browser to begin processing the first input made by the user. Further information on how this works can be seen further down this page. -
Largest contentful paint
Time it takes for the browser to render the the largest image or text block visible within the viewport. Further information on how this works can be seen further down this page.
MEASURING WORKFLOW TIMES
Workflow times can be measured using the 2 actions called Start mark and End mark in their respected places within a workflow. I’ve done a fair of testing with this to make sure they do actually report back the the correct perceived times from the browser and don’t run before they’re supposed to. You cannot measure backend workflows accurately using this process, this is for frontend workflows only.
Create a custom event and inside it place the End mark action.
Within the workflow you want to monitor, add the Start mark action as step 1.
At the very end of your workflow, trigger the custom event you created.
When the End mark action runs it will also trigger the A Performance end mark has been set event and if you add that then you can reference the Mark duration state which holds the length of time (in milliseconds) between the 2 actions.
Although we have the concept of adding actions as steps within the editor, they don’t necessarily run in the order you see them on the Bubble servers. From what I understand, custom events run in sequence, not parallel. Meaning, if one workflow triggers a custom event that starts another workflow, then this second workflow will complete before the remaining actions in the first workflow have run. It seems that by triggering a custom event at the end of the first workflow it does tend to be the last action that’s run (at least from my testing anyway!).
You can see various examples of this process on the demo page, check the green workflows.
TIME STAMPS
Times referenced within the Navigation timing and Resource timing state fields are subject to change format depending on the browser in use. From what I have seen and tested, it’s only Safari that will fallback to the Level 1 spec times.
Level 1 - times reported as 13 digit UNIX EPOCH timestamps (milliseconds).
Level 2 - times reported as a High Resolution floating-point numbers (milliseconds).
What this means…
Probably not too much, both sets of times can be converted to a readable date and both can be subtracted from one another to give additional measurements (of the same kind that is).
For example, responseStart and responseEnd are timestamps for the start of a response and when it finished downloading. If you calculated (responseEnd - responseStart) for a given resource, like an image or a video then you’d end up with the total download time in milliseconds, to which you could then divide by 1000 to get the seconds it took.
WEB VITALS
These are commonly known as Core Web Vitals statistics and were put together by Google to provide guidance on what they believe to be essential metrics for delivering a good user experience.
5 of these statistics are provided in this plugin, below describes what each one is in a little more detail.
-
First Contentful Paint (FCP)
This metric measures the time from when the page starts loading to when any part of the page's content is rendered on the screen. Content can refer to text, images, icons, videos or any other non-white canvas elements. -
Largest Contentful Paint (LCP)
This metric reports the render time of the largest image or text block visible within the viewport, relative to when the page first started loading. -
Time To First Byte (TTFB)
This metric reports the time it takes for a user's browser to receive the first byte of page content. It can be closely associated to monitoring server response times. -
First Input Delay (FID)
This metric measures the time from when a user first interacts with the page (i.e. when they click a link, tap a button, or use some other custom JavaScript powered control) to the time when the browser is actually able to begin processing the event handlers in response to that interaction. -
Cumulative Layout Shift (CLS)
This metric is a measurement of unexpected shifting of webpage elements while the page is still downloading. The kind of elements that tend to cause shift are fonts, images, videos, contact forms, buttons etc. This is reported as a score.
SERVICE WORKER
The service worker file is a generalized script that uses the most recent version of Google’s Workbox utility. It doesn’t require too much customization as it works pretty well in it’s current state. Further info here and the actual service-worker.js file can be downloaded here.
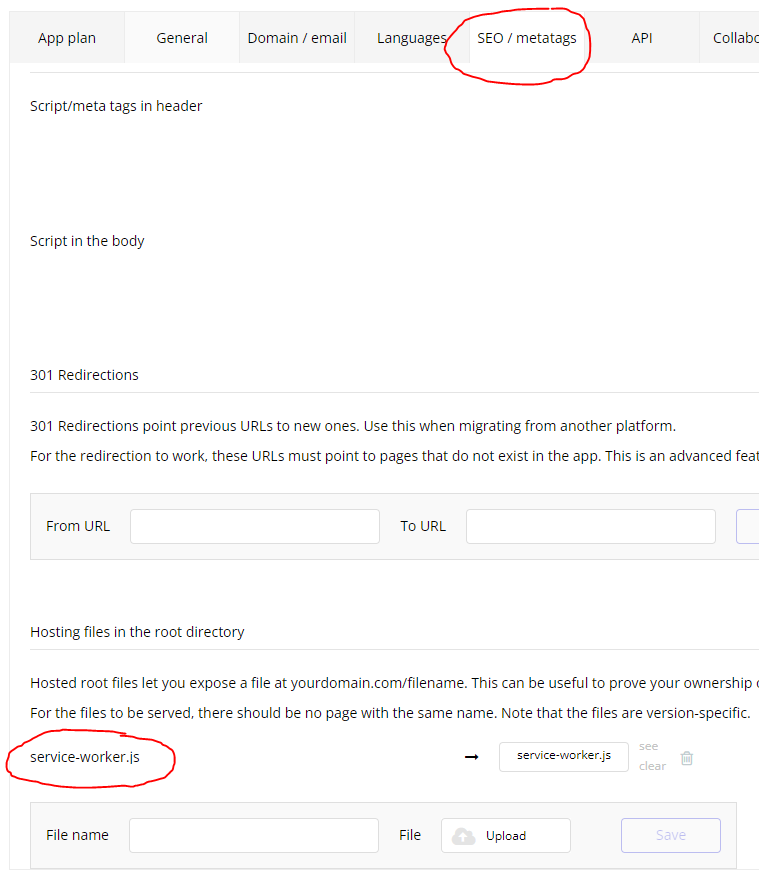
You have to upload the file to your root files section as shown here.

It’s currently split into 4 sections to control caching of the following and this will probably be enhanced as time goes on.
- images (images / icons)
- google-fonts (all google fonts)
- pages - (page navigations)
- assets - (css / scripts)
When the page loads after adding the service-worker.js file under your Settings area, there’s a couple of places within the browser tools that allow you to see this and confirm it’s working. It may take a refresh of your page and relaunch of the browser.
The service worker itself and it’s status

The cache names assigned to each of the 4 sections above

With regards to how this works, in general the browser makes a lot of requests to retrieve the things it needs to load your page correctly. The majority of such come in the form of images, fonts and other scripts alike, for example Javascript and CSS files, none of which are stored by default within the Cache Storage area of your browser. By utilising some method of caching we can help improve the loading speeds since the browser can retrieve the content directly from the cache rather than making another request to retrieve it again.
In essence, this works in the following way.
Your browser requests the data from Bubble web servers to display your page, if the content is not in the browser cache then it is retrieved directly from the web server. If the content was previously cached, the browser bypasses the server and loads the content directly from its cache. In general this gives performance gains and minimises bandwidth consumption to create a snappier experience when navigating through your site.
It’s important to note that anything which comes from your database, isn’t stored. So any data, whether it be confidential or otherwise is pulled in the normal way. I’m not 100% certain on how Bubble manages this but the browser cache is only a small database of files that contains downloaded web page resources only.
I think that’s everything covered for now!
If you’ve made it this far then hopefully I haven’t bored you to death quite yet ![]()
Overall, there’s a fair bit of data that this plugin can retrieve and whilst some of the exposed states provide a bunch of ready-made calculations, given that you have the raw stats within the Navigation timing and Resource timing states, you can potentially use these to work out other statistics.
Paul