[Shareware Plugin] BA Studios Charts - line charts, time series line charts, ohlc candlestick charts

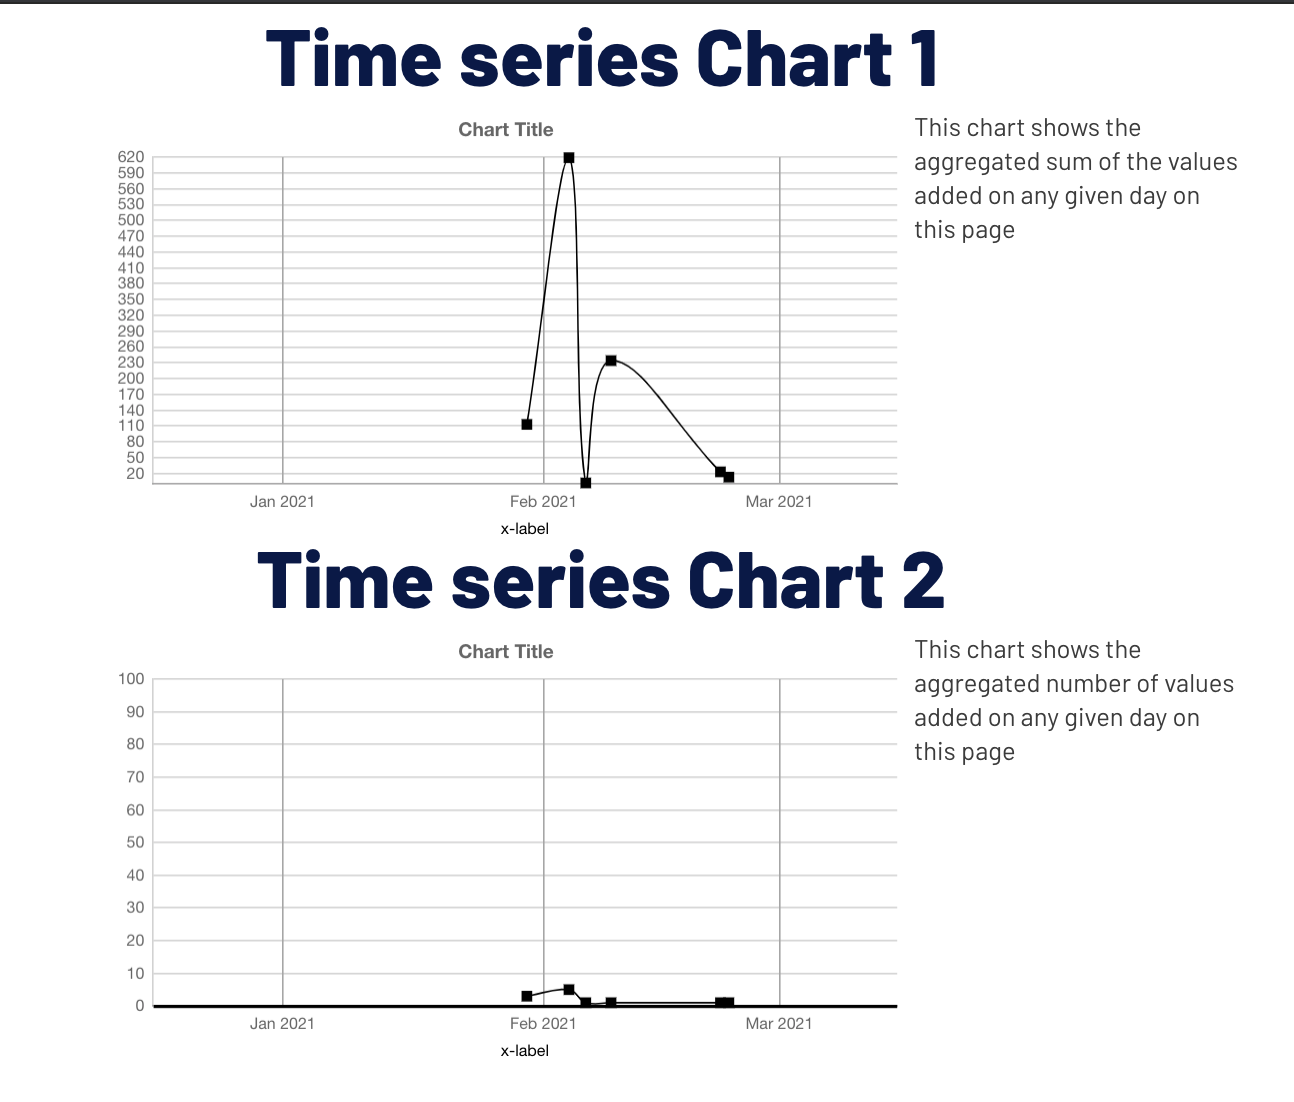
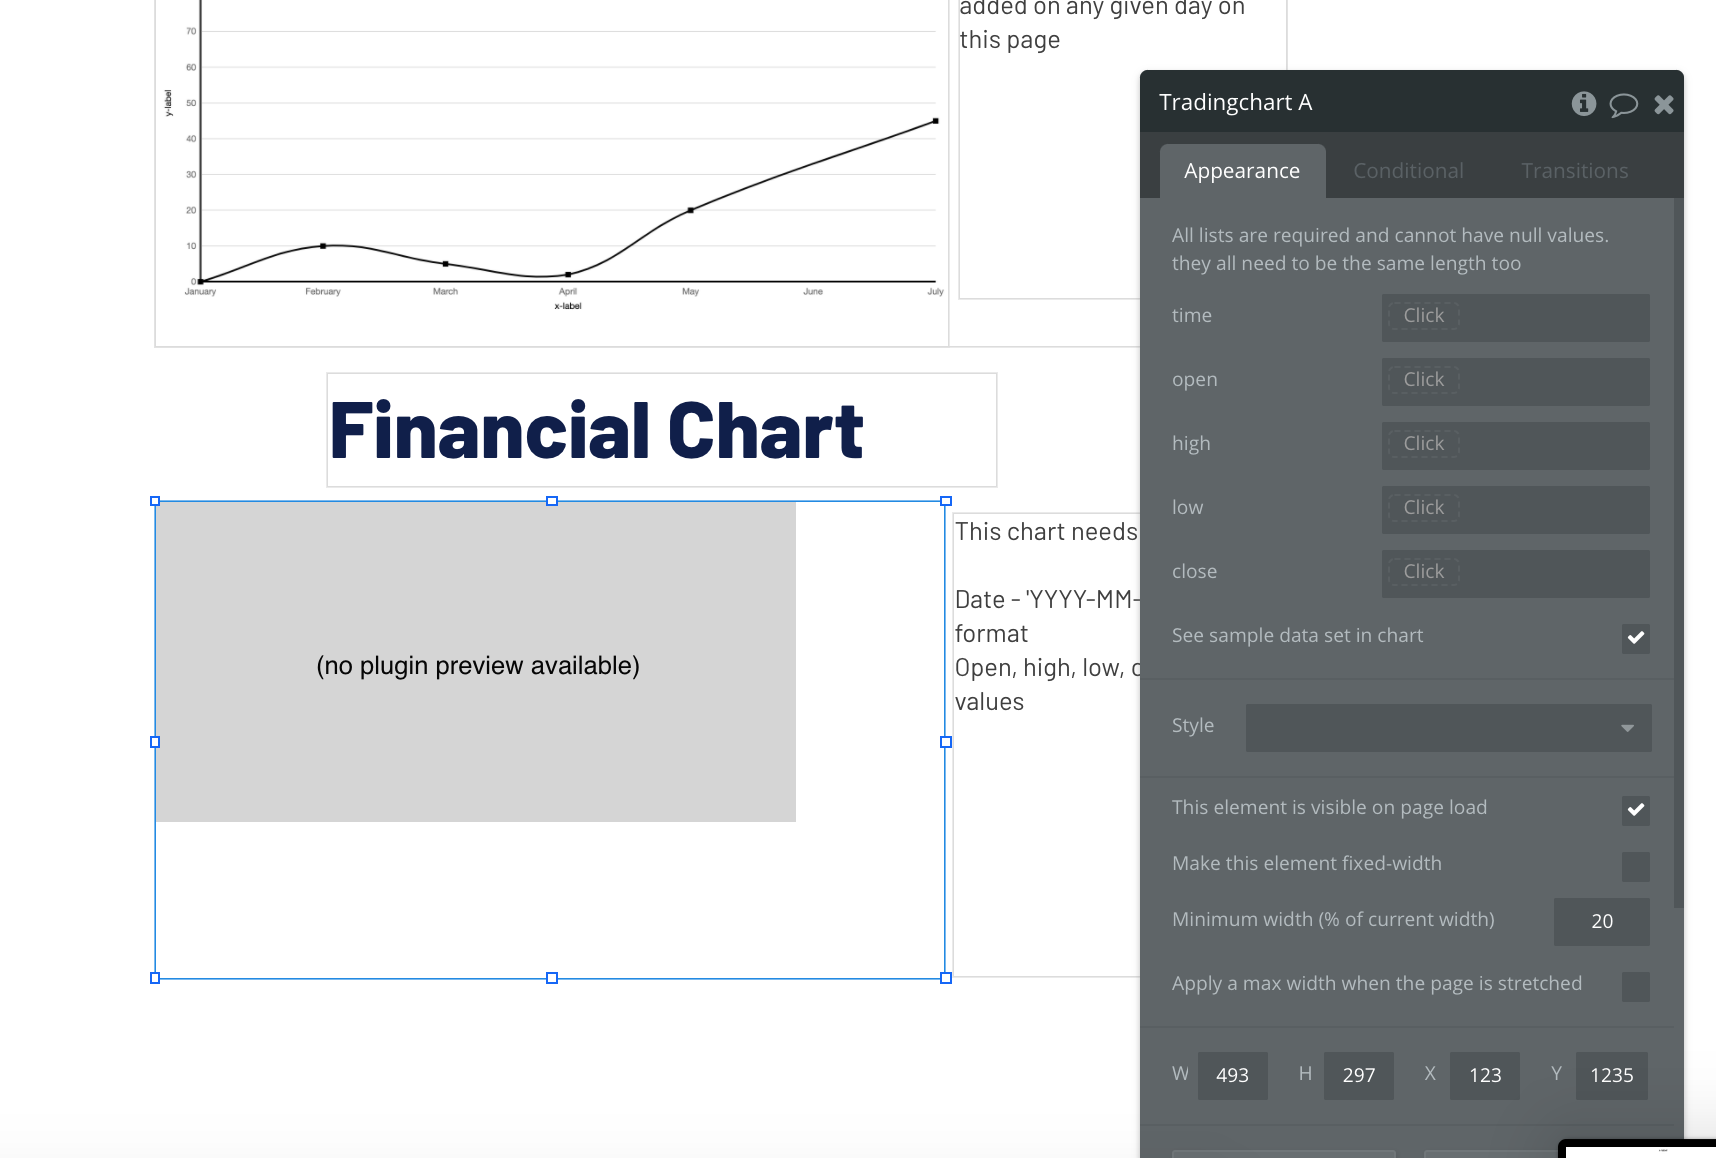
I wanted to share a plugin i put together for a project i’m working on. its a very customizable line chart. there are two versions. simple and complex. then a complex timeseries and most recently a financial chart.

i needed a line graph that would span and not break the line. i am relying on the chartJS library for this and hope it can help someone else out too!

Plugin Page

Editor Mode

Live Mode

[update]

[update]
-added financial charts

3 Likes

Update

ChartJS

live mode
Editor
Plugin page


Now live are candlestick financial charts! Let me know what customization you want to see!

Update

AmCharts

Editor

Live mode

A preview of the next chart to come! Feature requests are recommended and requested!

Radar/Spider web charts coming soon!

@keith and my 90’s computer nerd childhood have inspired me to keep this free and to keep growing and improving the project. Thanks!

Support this project!
https://mo.na/jaredgibb/4493

1 Like

Cool stuff, @jared.gibb! I haven’t had a need to try these out, but they look rad. (And you should really put up a little donations page - so easy to build in Bubble - to collect contributions for this project!)

1 Like

Hi, @jared.gibb
Thank you for making such a wonderful plugin!

I have a question.
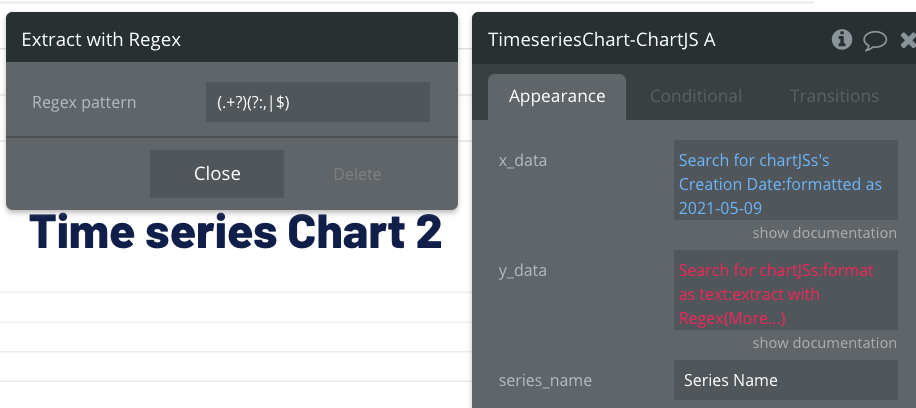
I want to use TimseriesChart, but an issue is displayed that I need to put a list of numbers on the y-axis. However, in the sample page you can put the number on the y-axis.

How can I put number on the y-axis?


スクリーンショット 2021-05-04 15.55.57

sure! have you been able to set this up yet?

See this post^^ Is this a duplicate of above? If that doesn’t answer your question I could probably record a loom video showing how to do that at some point this week

Thank you for your polite explanation!

I posted it once with another account, but it seems that it took time to approve it because it was the first post.
Sorry for the duplicate posts🙏

I set it as described and solved it!
I will continue to use this plugin in the future!

1 Like

Awesome! Happy to help

1 Like

Thank you for answering the question the other day!

I have one more question.
I want to display the percentage on the y-axis of timeseries chart, like A’s count / B’s count.
Is this possible?

sure! have you been able to set this up yet?

Awesome!

I could set it to “A’s count”, but I couldn’t set it to “A’s count / B’s count”.

I want to create a state of “A’s count / B’s count” like the image, but Do a search for is not displayed in the options after setting A’s count.


hey @taka! it’s a slightly advanced feature but you got this!

you should be able to do something like this format as text, extract with regex, and convert to number?

Screen Shot 2021-05-09 at 7.11.49 AM

1 Like

Wonderful!

I tried to set it referring to the explanation!
But, there seems to be something wrong yet😭
I will try a little more!


I am trying to use the plugin, but cannot get it working. Here is the test setup:


The result I get is this:

What am I doing wrong?

1 Like

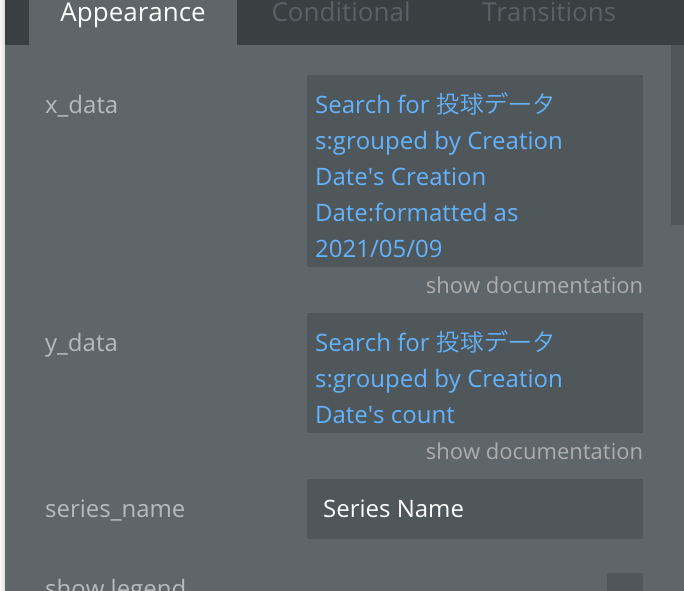
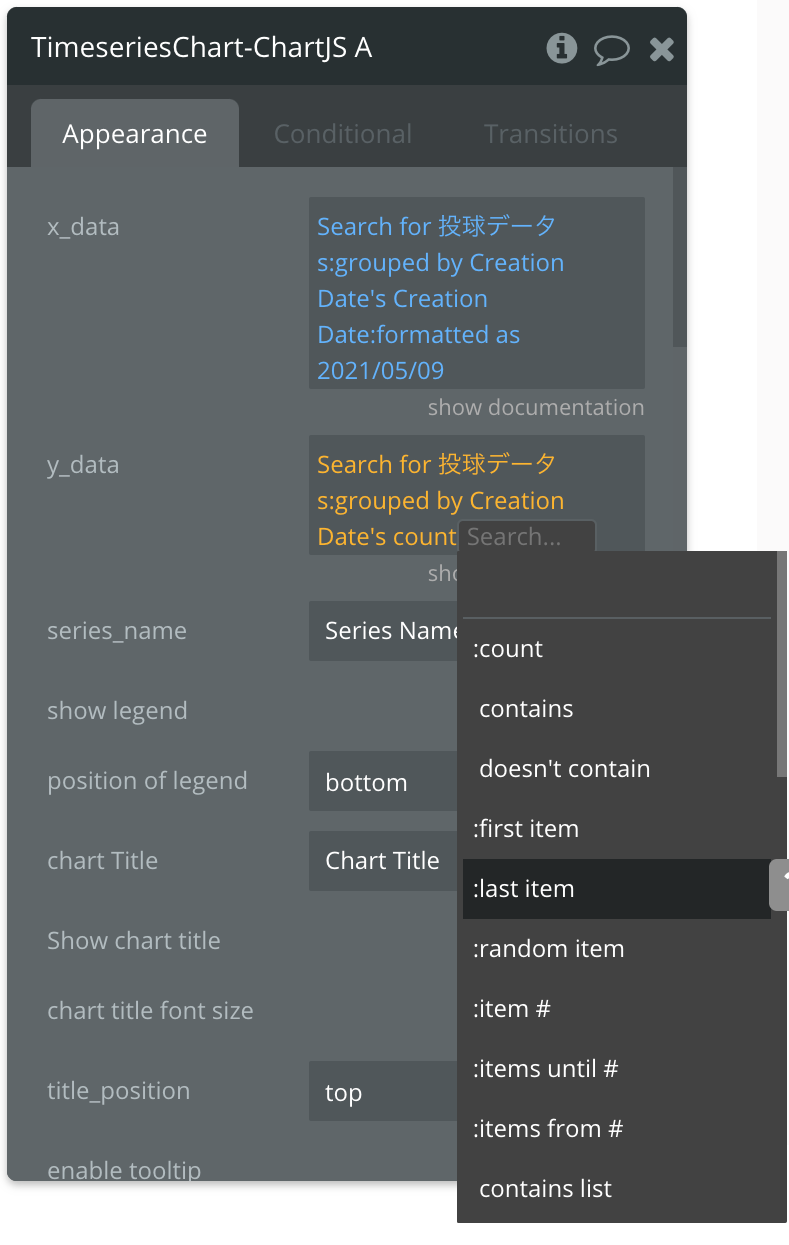
I am trying to use the plugin but I can’t make sense of it. Looked at all the posts on the forum but there is nothing that helps. What are we to put in as data in the series data set of the Line Chart exactly?

I am trying to count my tickets by submit date here yet the plugin keeps throwing a red expression in the Series 1 Dataset regardless. It’s not telling me what it wants. Can you help?