
Hey,
I’m using the Chart - Simple Charts and Graphs plugin and I need some help.
How can I create a bar chart where the x axis is dynamic i.e. it will update automatically as the days go on?
For example, if a new contact is created in my DB, the bar chart will reflect that the number of meetings that happened that week.
I am having the same issue, but I found this info, I hope it helps you.
I am going to try it.
Hi all, looks like there is a general need for more dynamic examples on the editor page for the Simple Charts plugin – I’ve been working on more dynamic examples and should have them ready by the end of the week.
Happy New Year!
Alex
TechBlocks
Thank you @alex4, you have a great plugin.
@eilongold2503 bellow a chart-pie example. You define everything in the plugin info, I included 20 colors (from a personal palete) so I can control up to 20 series colors.

An a Chart-Bar/line example with multiples series.

- Define the x Axis Values in the plugin elements.
- I use the plugin “Utilities(Bdk)” - the option List Processor- or the plugin “List Shifter Karma-Ware” to handle the list of series
You start the list processor run when you load the page. - The processor handles all the series
I use the list of 20 colors unify the palette on all my graphs.
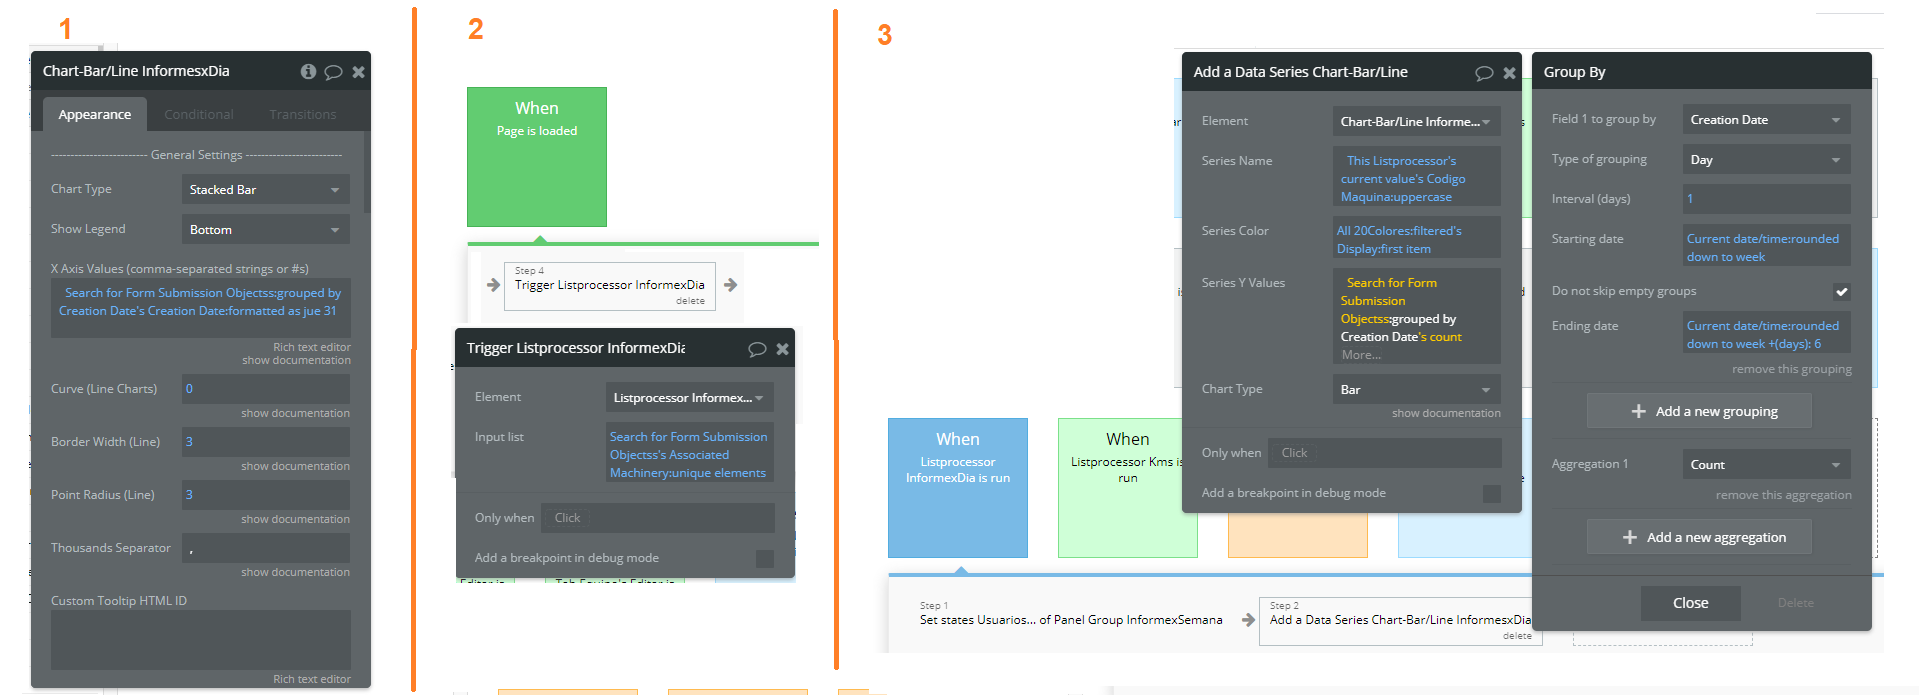
Let me know if you find a more simple way to do it.
I hope it helps you.
Thanks for adding that info, Edwin! Cross posting a message I mentioned in another thread in case it’s helpful for you all here: