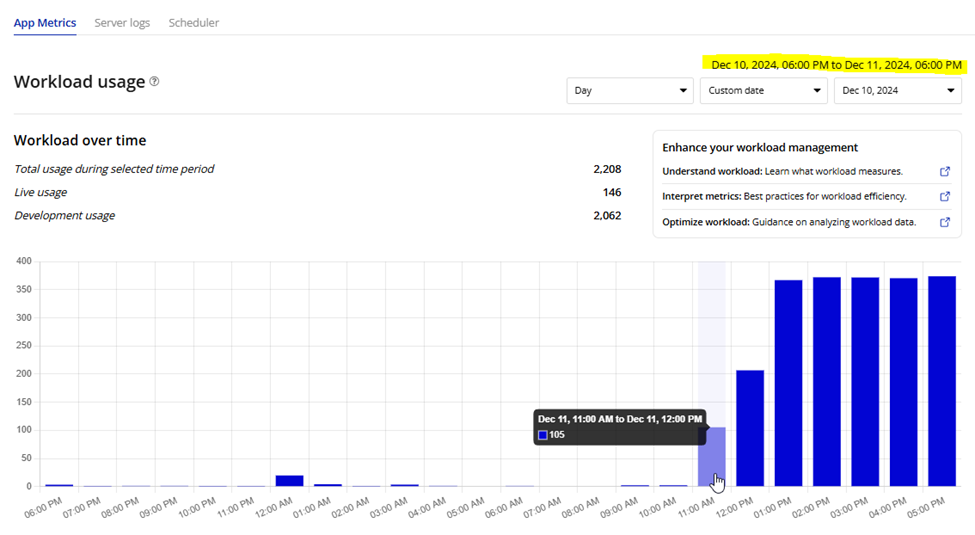
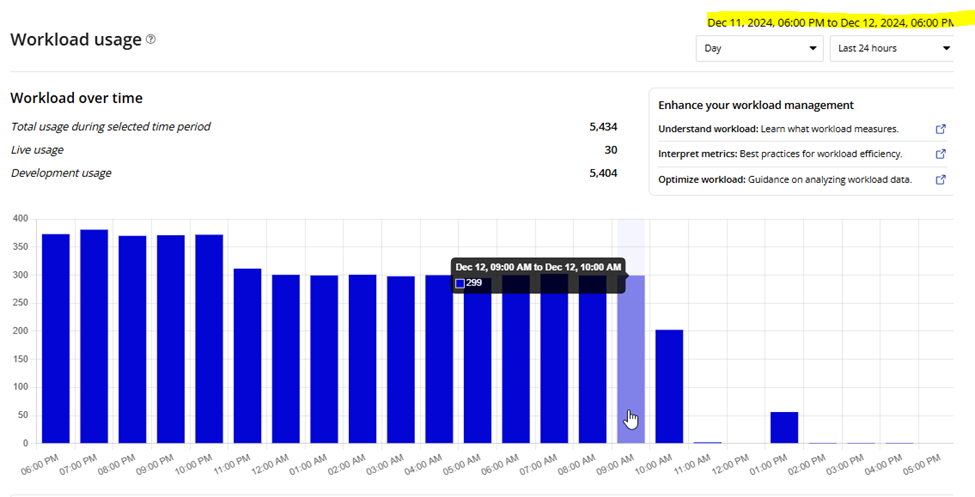
In a 24-hour period (Dec 11, 11am - Dec 12, 11am), the dev Workload Units significantly spiked. I had not made any changes to my app prior to that, nor after that, so I don’t think I did anything that “turned it on” nor “turned it off”.
I don’t understand why the increased usage doesn’t show up in the Server Logs.
For instance, using the App Metrics for Dec 12, 942am, it shows 684 searches:
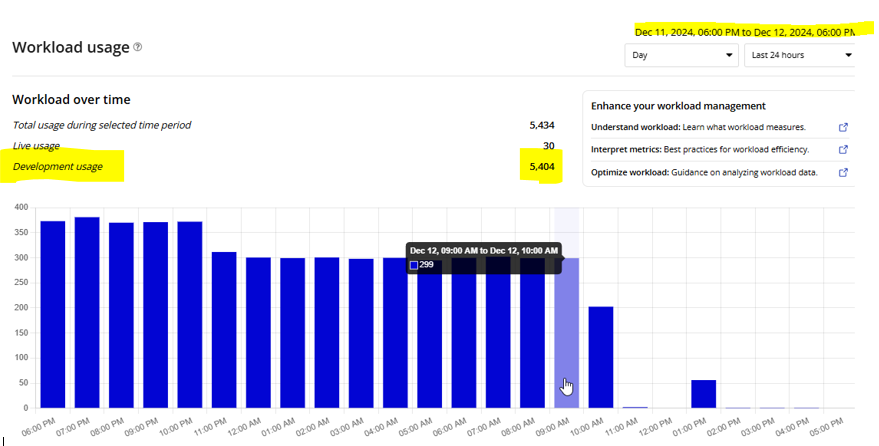
The “spike” is in the ‘Dev’ Workload Units, updated screenshot below. But looking into the App Metric, I guess it isn’t showing in the Server Logs because the source that’s causing it isn’t a Workflow, it is a “Data Source: Search for…”
The Thing it is searching for only has 9 items in the ‘Dev’ database, but the Workload Usage shows in a 1-minute Window there were 684 Searches done. I don’t understand how that is possible.
My understanding is that 684 Searches / 9 Items = 76 Actual Searches / 60 sec = 1.3 Searches per Second.
If it was being “triggered” by a Workflow, that would show up in the server log, but it isn’t.
Any other suggestions would be greatly appreciated!