Hello All,
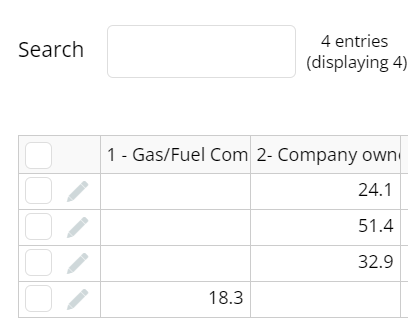
I would like to get all the aggregated data in screenshot ONE added together in two separate bars on a bar graph.

My series data is currently as the screenshot below;
and series category is as below;
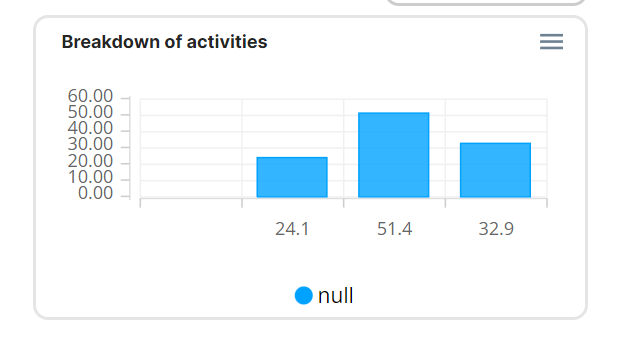
but I am getting the final graph come up.

As you can see I get 3 separate bars but only want 1 for 1 series of data. 2 for 2 series of data and so on…
Is my category wrong and is my data series wrong as well? Perhaps I should be using grouped or aggregated but every time I do it turns red with an error message.
Please help! Thank you!


