Hi,
Venturing into an area that I haven’t ventured before and have been doing a lot of reading on how to best achieve what I need.
As I understand it, the out of the box Chart plugin in Bubble is limiting in that it requires a simplistic ‘x’ and ‘y’ values to plot on a chart. Without the brains to be able to :sum or :average data specified for a period. As an example where there is a list of Coupons redeemed which are associated to a Venue. It lacks the ability to work out and trend the number of coupons redeemed for a venue month-on-month.
So, therefore as I understand the data is either required to be manipulated and saved into a Thing that the Chart can handle given the ‘x’ and ‘y’ data points required.
So two questions:
-
With the use of other external resources (eg; Blockspring, Google sheets, etc.) what is the best way to export the raw data to be “summarized” and then fetch the data back into Bubble so that it can be handled by the Chart pluging?
-
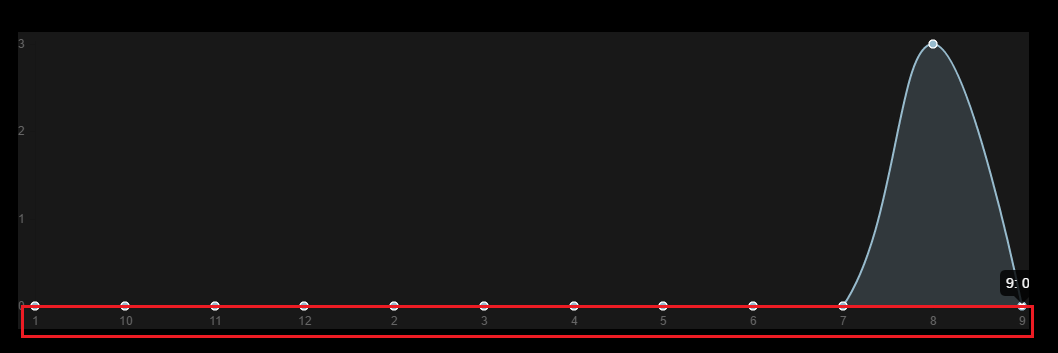
The ‘y’ values of the chart below are stored in a field called Month (type: Text) which is populated by extracting the :month from Current Date/Time. Question is that the ascending order is not correct. - is this a bug with the plugin? changing the sorting to descending just shows the reverse.
@emmanuel
any ideas why the order of the ‘y’ values are out of order? even after applying sorting?
as you can see ‘10’, ‘11’ and ‘12’ are coming before ‘2, 3, 4…’?
is it stored as text? This can affect the sorting
Also for a aggregation of data has been requested and requires an additional development, see this link
https://featureseed.com/request/create-queries-as-views-like-in-sql-1471407349671x472895468794019840
@AliFarahat it is stored as a Number.
It appears that the sorting looks at the next character in a double-digit number like ‘11’, ‘12’ etc… and is placing them before the next single digit number ‘3, 4, 5, etc…’
Based on your post, I think the single digit numbers might need to be 01, 02, 03 etc., but I would be surprised if it doesn’t do this automatically. That would seem like a weird oversight, or possibly even a bug.
@potentialthings
its definitely a bug, the sorting works when I add ‘9’ to the front of numbers >9, as it then looks at the next digit value for sorting.

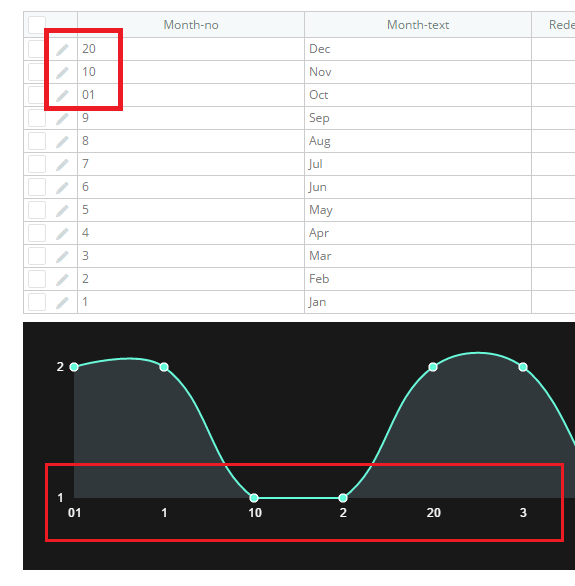
What happens if you have a 01, 10, and a 20? Just curious now, as the example you showed above is actually correct (910 is greater than 9).
@potentialthings
When I enter the numbers you suggested is even more confusing…
In this example when I enter ‘010, 012 and 013’ it sorts them at the start because ‘0’ is the lowest first digit.
Is it possible that the chart element converts the numbers to text when plotting
Very very possible, and that would explain the oddness. Tough to tell, I’m not sure how much visibility into the charting library we have