
I built a dashboard which shows metrics based on date ranges. With performance in mind, what’s best way to search for data and display it?
I’ll illustrate with an example from Subsocket.io built by @Thimo:
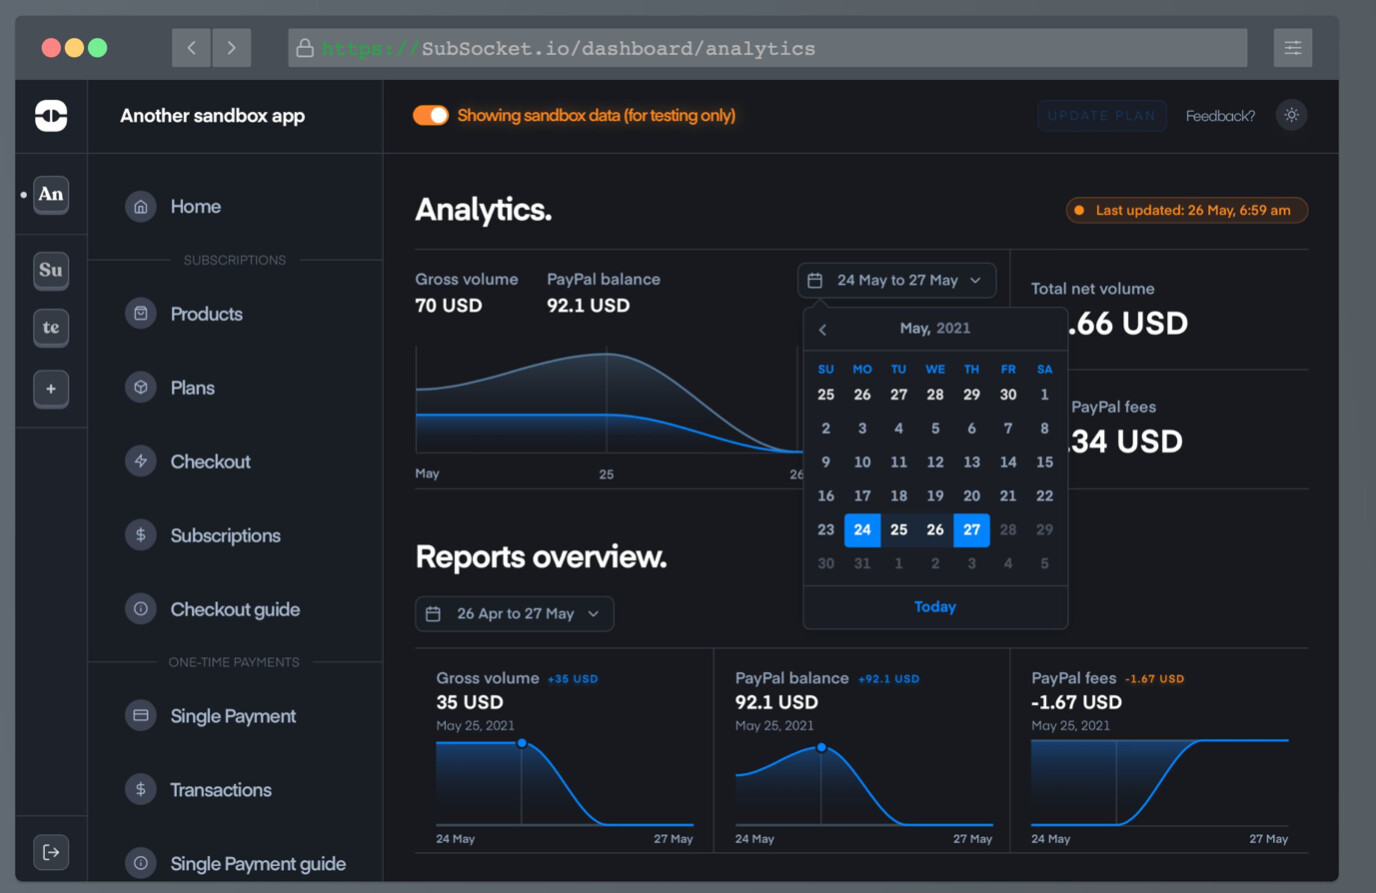
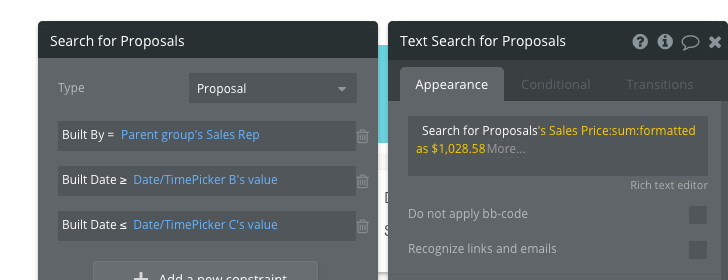
I’m guessing each metric in his dashboard above is text with a Do a Search For filtered with constraints based on the start and end date of his date picker. Maybe something like this:
Thimo has roughly 6 metrics on that page, so picking new date ranges won’t be too heavy on bubble.
But what if Thimo wanted to show something like a leaderboard of 60 sales reps, and that leaderboard had a date range picker.

This would cause 60 complex searches on the page. And then it would redo the search each time date ranges were modified.
I have something similar to the above, and it’s timing out. Bubble limits how long they allow quires to run - which causes the timeout.
Does anyone recommend a better solution?