Hi there,
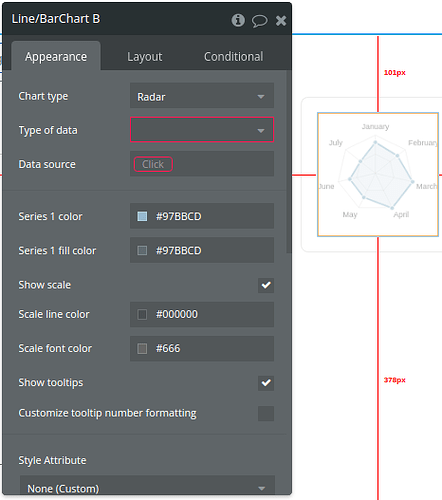
I’m trying to setup a diagram view of showing the possible outcome of a data change. I using an external API to receive the data back and then show the outcome in a pie chart. The API data I receive is in “text” format, which is not taking as a value in chart element.
Let me explain with an example to make it super simple:
Lets say OpenAI API (not actually, but for example understanding), it returns values as “text” format, The values aren’t working with Charts element.
How can I solve this?

