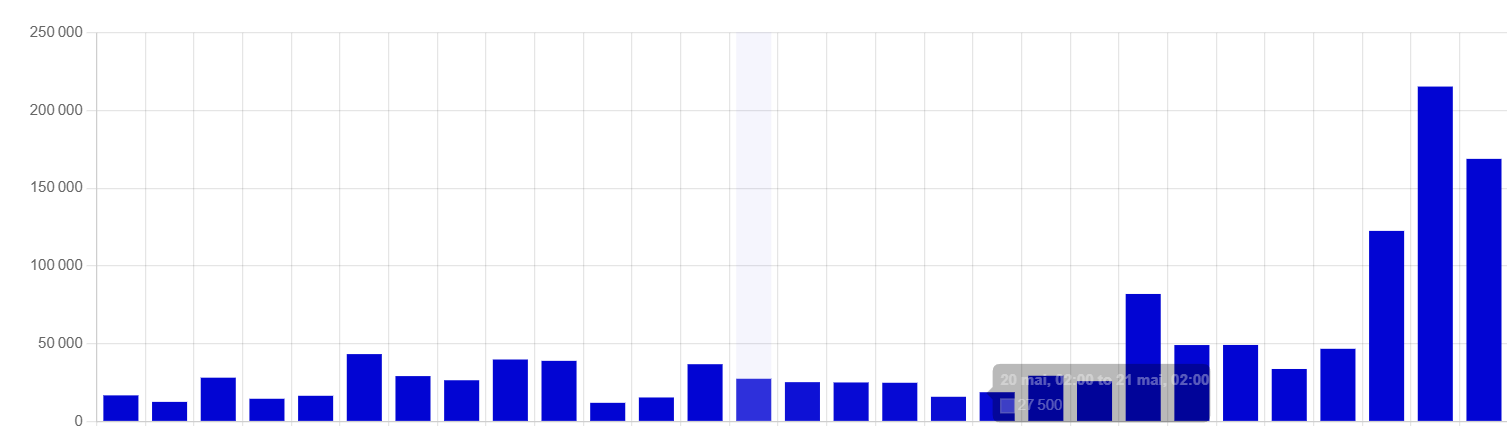
Since Thursday, May 28th, when we did a final deployment, our WU consumption has skyrocketed. We rarely exceeded 50K/day, but now we’re sometimes at 200K.
However, it’s very difficult to target.
When I dig deeper into the activity, there are two main things:
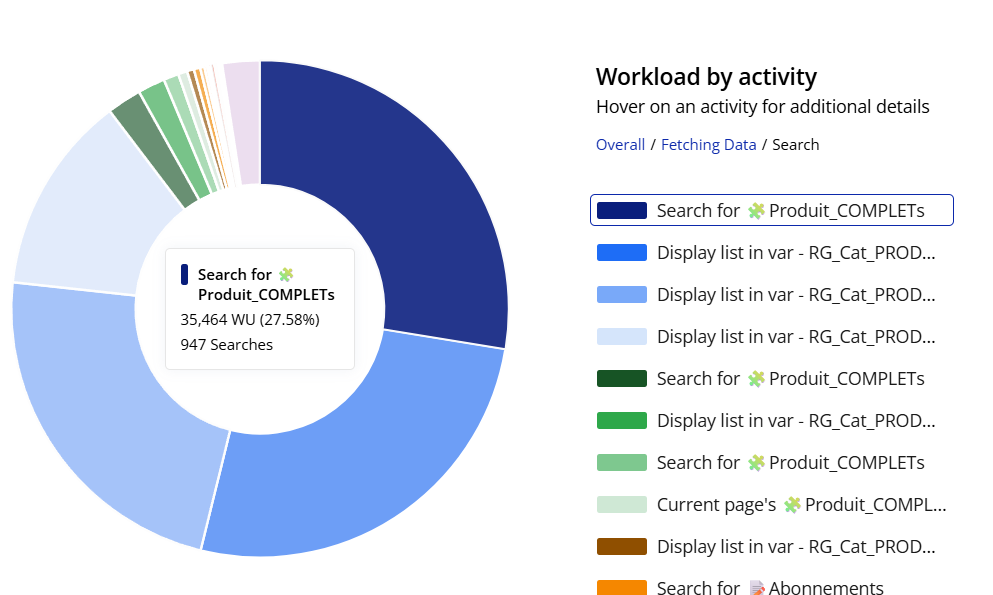
First and foremost: Search Fors on one of my product tables (our catalog) => this is surprising because the number of searches is similar to before, but it’s the related WU consumption that has increased tenfold (for example, the first consumption line, for 900 searches, was more like 2,000 WU and now it’s 35,000 WU!!!)
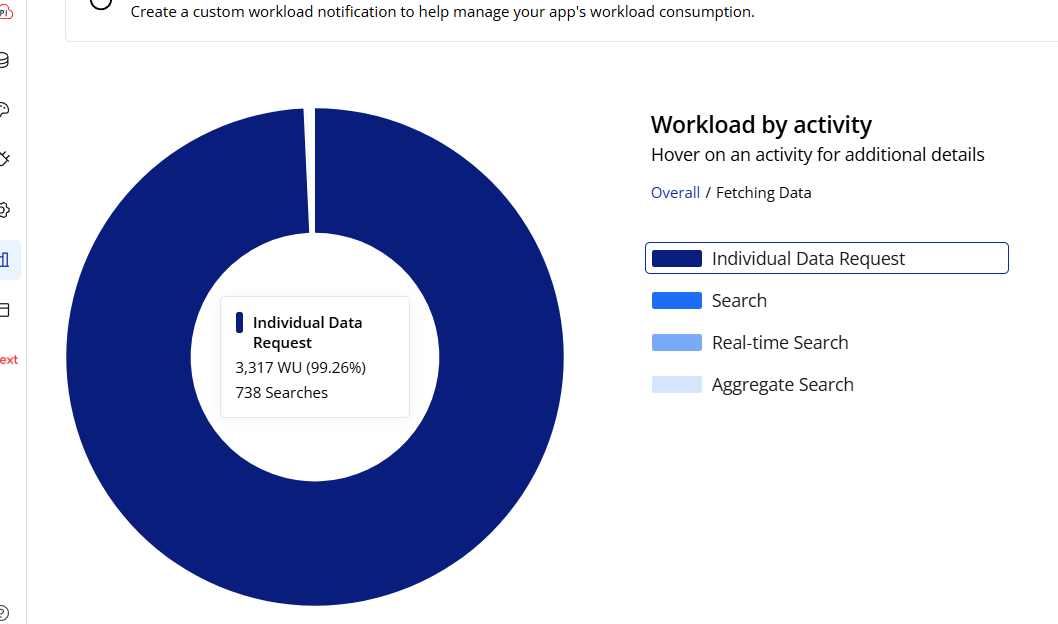
We also have: Individual data requests => this was minor before, but now there are sometimes significant consumptions. And nothing appears in the logs.
As for the causes, I’m very perplexed. For this latest deployment, we’ve touched:
privacy settings (basically limiting the sending of certain unnecessary data for certain profiles), but I don’t see how that could cause requests to explode, on the contrary,
on private pages, we’ve added redirection rules if we don’t have the correct attributions => ditto
We haven’t touched the main page concerned (catalog). The traffic is constant.
I can’t explain this at all. Have you ever encountered this? Do you have any leads, please?
WU also considers the amount of backend processing time spent, data passed around in the backend and the size of the data returned. Since the number of searches are the same these are the other possibilities I can think of.
Individual data requests trigger whenever a singular record gets updated in the backend, triggering all running clients to run the data request. Were there mass updates happening during peak user count?
Conditions can trigger individual data requests too.
The more we dig and the more we progress, the more I wonder if it’s not Bubble’s fault…
We’re comparing the last few weeks, and for the same actions (and the same number of searches), we have a WU consumption x10.
For a “Display list” (of a table that has barely changed. Still the same number of products), there’s no reason for this action to explode in consumption.
Has anyone encountered the same type of problem?
I’d like to understand if this is isolated to our application or if it also affects the general WU counting method.
I’ve been talking to someone else who seems to see the same trend of WU increasing over the same days (roughly May 27th to today with a peak around June 3rd)
If it is the case, then this would not be the first time that a bug crept into the workload unit charges and began overcharging. Search through the forum, I think at least two incidents in past 6 months where WU charges with multiplied due to a bug that affecting many apps and any app owner who reported it and was affected was reimbursed, those who did not report would likely have not been reimbursed as Bubble didn’t announce any feature implemented to alert affected app owners.
I believe this is also true of server side conditional checks. Any test I’ve ever run for server side conditional checks shows individual data requests rather than ‘conditional evaluation’.
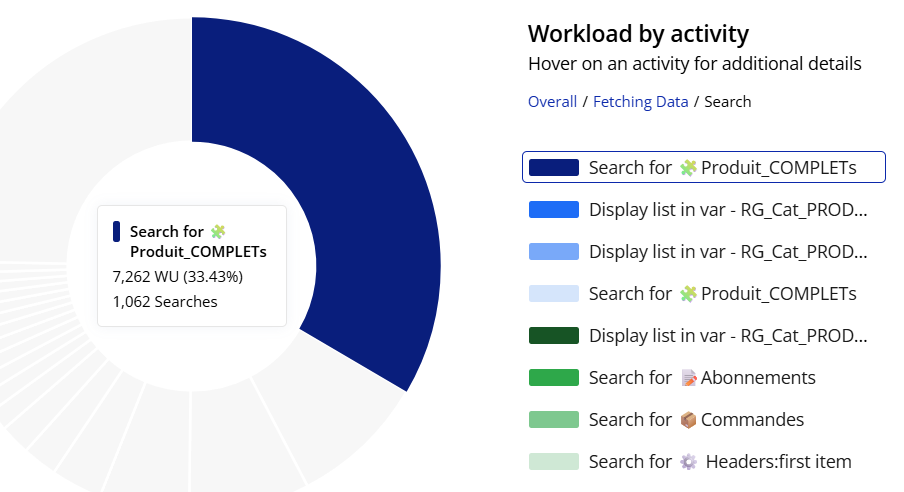
Your numbers do indeed seem puzzling. Despite the fact that the percentage of total is relatively the same (week earlier 33.43% and current being 27.58%), which would indicate relative stability in the usage, the total WUs versus number of Searches is way off. There is no valid reason why you would have gone to an average of 6.83 WU per search a week earlier to 37.45 WU per search now, especially as the percentage of total WU consumption is relatively stable. What that would imply is that ALL of your WU consumption metrics are off to a similar degree that they are off for that one search of Produit_COMLETs
Also, the increase in individual data requests is not large enough to explain the jump from 6.83 WU per search to 37.45 WU per search unless each search is return many more items and each item is containing many more characters of data.
Did you when altering privacy rules or adding in redirection rules, are they relying on any types of conditions that are fetching data?
Thank you for your reply.
It’s interesting and clearly worth considering.
In my case, I’m really looking forward to Bubble support’s response because it’s not normal for the same action (“display list”, for example) to increase consumption tenfold a week apart when there hasn’t been any major change.
Thank you!! Indeed, I have seen other cases and I hope that this is just a bug that will be corrected (and a refund would be better in this case)
What do you mean by that?
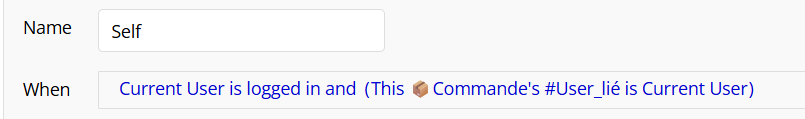
I generally (and at a minimum) check that the item is linked to the Current User.
For example, here, that the Current User can only see his commands linked to him :
I know it’s not quite the answer you were looking for but I’d recommend using a third-party search engine for any intensive searches. I use Algolia. The search cost is tiny in comparison. If you’re interested and want to know how to set it up, just say.
Thank you for your reply. Yes, indeed, Algolia is also a good solution. I still prefer to outsource my database to improve performance and reduce consumption.
I finally found the solution!!!
I reimported an old backup of my Product table and it’s fixed!! Following a bulk update, I had added additional photos to each product (basically, before each item had 2-3 photos and after a previous update, they had 7-10 photos). By overwriting just this “photo list” field, everything returned to normal… But this isn’t normal. Having more photos could potentially slow down loading, but that doesn’t explain why the DoASearch consumption was multiplied by 10!!! These are just additional URLs whose images aren’t called in this case. At worst, we should have had a consumption of 7-8 WU and not 40 per query. I asked support for an explanation but I haven’t heard back yet on this subject.