I’m trying to understand how I can create a map like this showing the crime rates of each borough of London.
I’ve downloaded the Leafy plugin but I don’t understand how the information is added so it looks like this.
Hahaha I can’t help you with Leafy. But the physicist in me is impressed with how crimes scale with the square of population density, and hence the rate scales linearly with density. Why? Because crime is a type of interaction and all interaction rates scale with the square of density.
Also have you looked at the Viridis family of colour blind agnostic linear perceptually uniform colour maps, instead of the traditional heat map?
@vini_brito do you think that leafy maps would be able to do something like this, so long as the lat/lng boundaries are known as well as the number of crimes per 1000 population for those boundaries?
Thanks all for the mention! Leafy would need an upgrade for this to be easily done, but with some work, specifically attaining the data and formatting it in the right format, you can use the general purpose “Draw polygon” feature and each borough would be a polygon.
You would need to loop and in each iteration create a polygon with the boundaries of the borough and the “Fill color” would be based on the rate number.
There’s more involved in this logic, but this is a start.
Whenever someone sponsors it then depending on my work’s schedule.
If you or someone else would be interested in sponsoring heatmaps in Leafy just send me a private message.
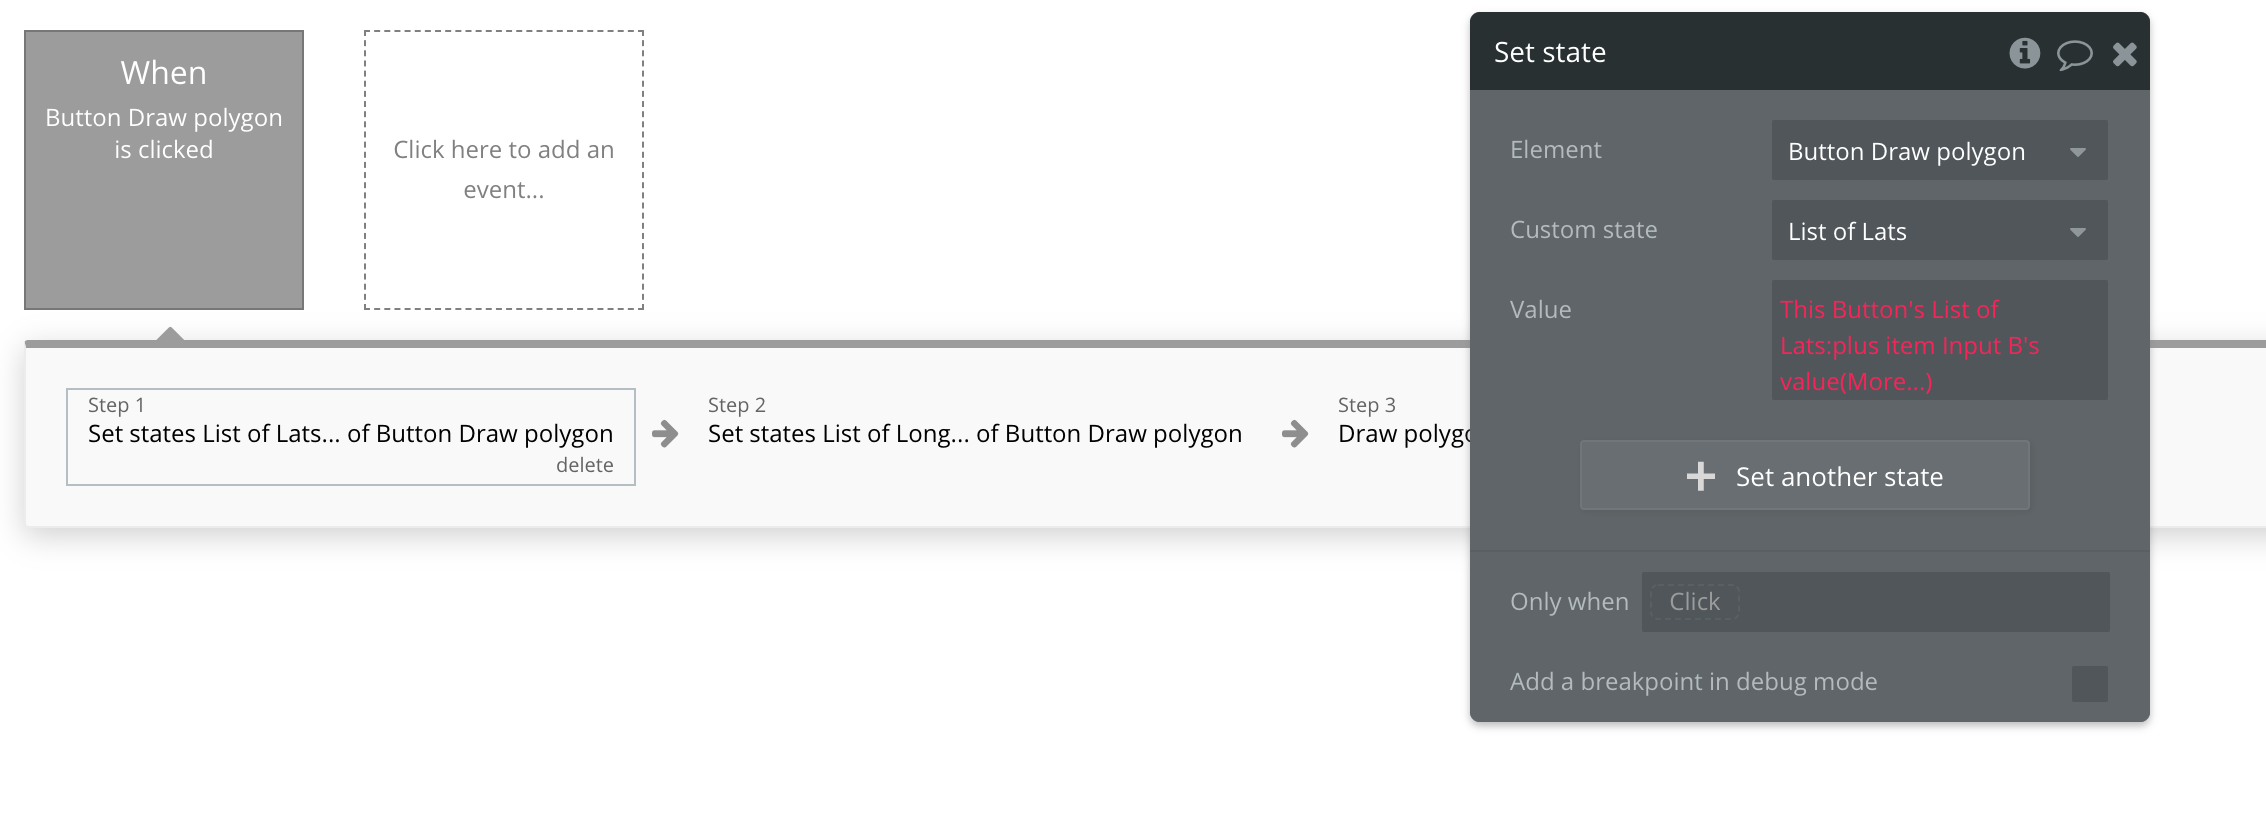
Is there any video or tutorial on how to use this polygon feature?
I’m still trying to make this map work and I’m really struggling.
I now have all the data I need. I just need to know how to upload it into this map.
I was looking at what you have written in Bubble’s forum about Leafy and I’m not making much progress with that information alone.
I’ve got stuck right here in this part:


 then depending on my work’s schedule.