The issue in my opinion is a shortcoming with with Apex charts.
I don’t see a way my plugin could be used as a data basis for anything. I’d see it as something supplemental when @Thimo’s plugin doesn’t fulfil my needs.
If apex offers a timeseries style chart, the issue you are experiencing shouldn’t be an issue I would think
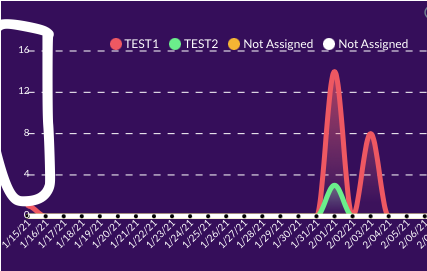
You could group your data by the ‘date’ you want to use and check ‘don’t skip empty values’ and handle the empty dates this way. Did you already look into a solution like this? This does not continue the line, but will cut it off. You can also select the option in the chart properties to replace these empty values by 0 to have it go to 0 every time. I have created a demo for you so you can see how this looks:
I had done exactly that in the groups function (“don’t skip empty values”) but I did not notice the “replace null/undefined values” option at the bottom of the chart settings. That totally worked for me! Thanks again for your awesome support.
I do have one last issue/question. Sorry for coming back with questions but one thing I just don’t seem to be able to resolve is the following:
On my y-axis the numbers “touch” the grid lines. Can you tell me where I can find the option the increase the offset in the multi area chart? I did find it for the x-axis but not for the y-axis:
Is it possible to feed OHLC historical to an APEX candlestick chart from a custom data API (My own)? How does the data need to be formatted to display correctly ?
Hey @Thimo have purchased… wonderful!
On a horizontal chart with say 200 y labels there is a lot of screen realestate. Is it possible to scroll up or down the chart from say te tenth entry etc? So you can do a top 10 and then keep scrolling and see the remainder.
Thank you