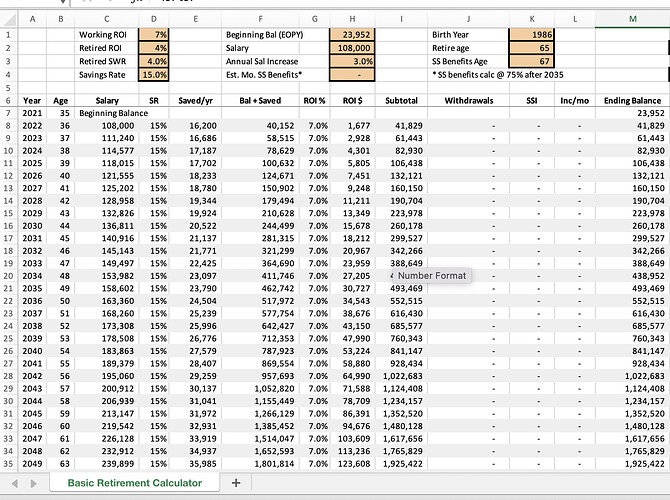
Hi everyone. I’m building a retirement app and one of the features I want to deploy is being able to show a user how much they’ll have when they retire. I built an excel spreadsheet. The two data points I need to be able to capture is the YEAR and ROI(balance). During the onboarding, the user will provide their yearly salary, beginning saving balance, age, and retirement age. From that I want to be able to calculate the retirement balance by year. My initial thought is that I’ll need a workflow to create entries in my database for an ending balance for each year.
Any suggestions for how to set that up is greatly appreciated. Thanks all.

