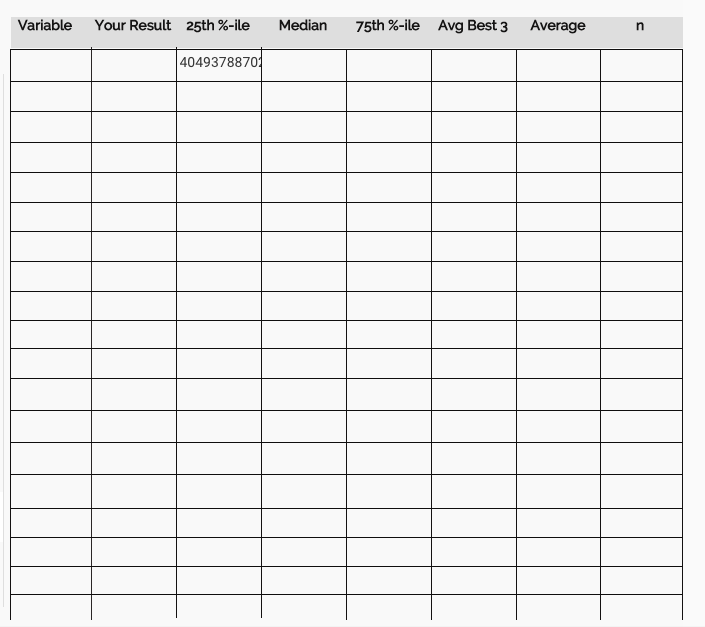
Is there a better way to draw table such as this ( repeating groups wouldn’t work here). I have used ‘shape’ to do this, however, would be better if there was a rows and columns element for the user inteface. (Or is there any that I am unaware of?). Or is it possible to split group element into rows an column to contain text in each cell with variable data source ( in this case API call to google sheet using blockspring)
Thanks @NigelG. See my reply for why a repeating group wouldn’t work. I was of the impression that there may be a simpler drag and drop UI element to create a table, where the individual cells would be programmed to make google sheet API call using blockspring to display some variables, with conditionality defining the type of data to fetch based on the user input on the input form on previous pages.
I can’t really think of a good way to do this. I suppose you could have the categories -variable, your result, median etc, all be different things and then arrange a thin repeating group (fixed cell) for each right next to each other as to look like a table. But I don’t think this is what you are looking for.
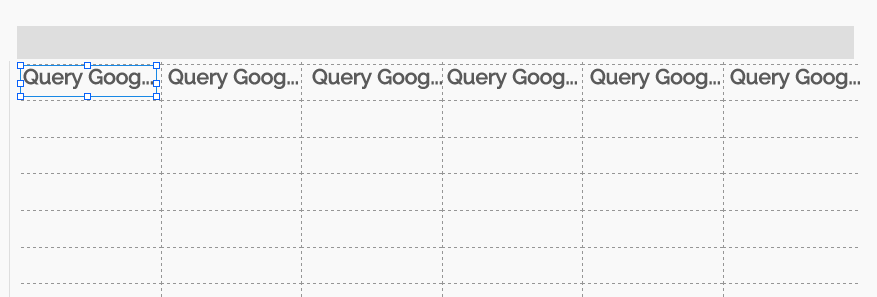
Maybe I am missing the point, but you can draw the structure of the grid using a Repeating Group. Then put a “No background” group (or shape) over the top of it.
And then you can drop elements on top.
As an alternative, maybe set up your structure as a thing (but don’t populate the database) and then create a custom state with a Custom State ?
Thanks @Nigel. Followed your suggestion and that worked like a charm . I hadn’t thought that I could put other element inside a repeating group without it being repeated, however, your solution to skip the first row by masking it with other element worked.