Need troubleshooting tips -- Chrome crashes randomly

I’m having a handful of users on Chrome on macOS complaining that the app crashes on them. It starts flickering and becomes unresponsive. Only a force quit solves the situation.

I’ve even had it myself, but I find no way of reproducing it. I’ve just wired Posthog to send memory usage, long-running processes, and failed 3rd-party loads.

I’m about to enter a session of profiling memory (again) to spot any thing – I’m guessing it’s a runaway process that is driving up memory usage.

Do you guys have some troubleshooting tips for me?

It could be something as simple as loading too much data on the page load at once … can’t say for sure without more context. It sounds very memory usage related though.

1 Like

Indeed, that’s my hunch. I’ve already disabled so many things and nothing is solving it.

Is it weird that Bubble’s js loads multiple times?

The Bubble editor is also out of hand.

1 Like

From this screenshot alone I think you either have a repeating group that either doesn’t have enough constraints or you may be loading the entire data set and then filtering. I also see duplicates, so you probably loading this data more than once. Could be a nested repeating group. If its not a repeating group it could be a page load trigger that fetches too much data …Heck it could even be a get call with pagination. I know you know this but it always helps to remind each other you don’t want to load more than a 100 records at once. It could be anything, but i guess the bottom line is you searching through too long a list and its possible that its mulitple searches. I’m speculating though hope it helps.

1 Like

I would go to app metrics and analyse the workload usage surrounding the time range where your users notified you of the crash.

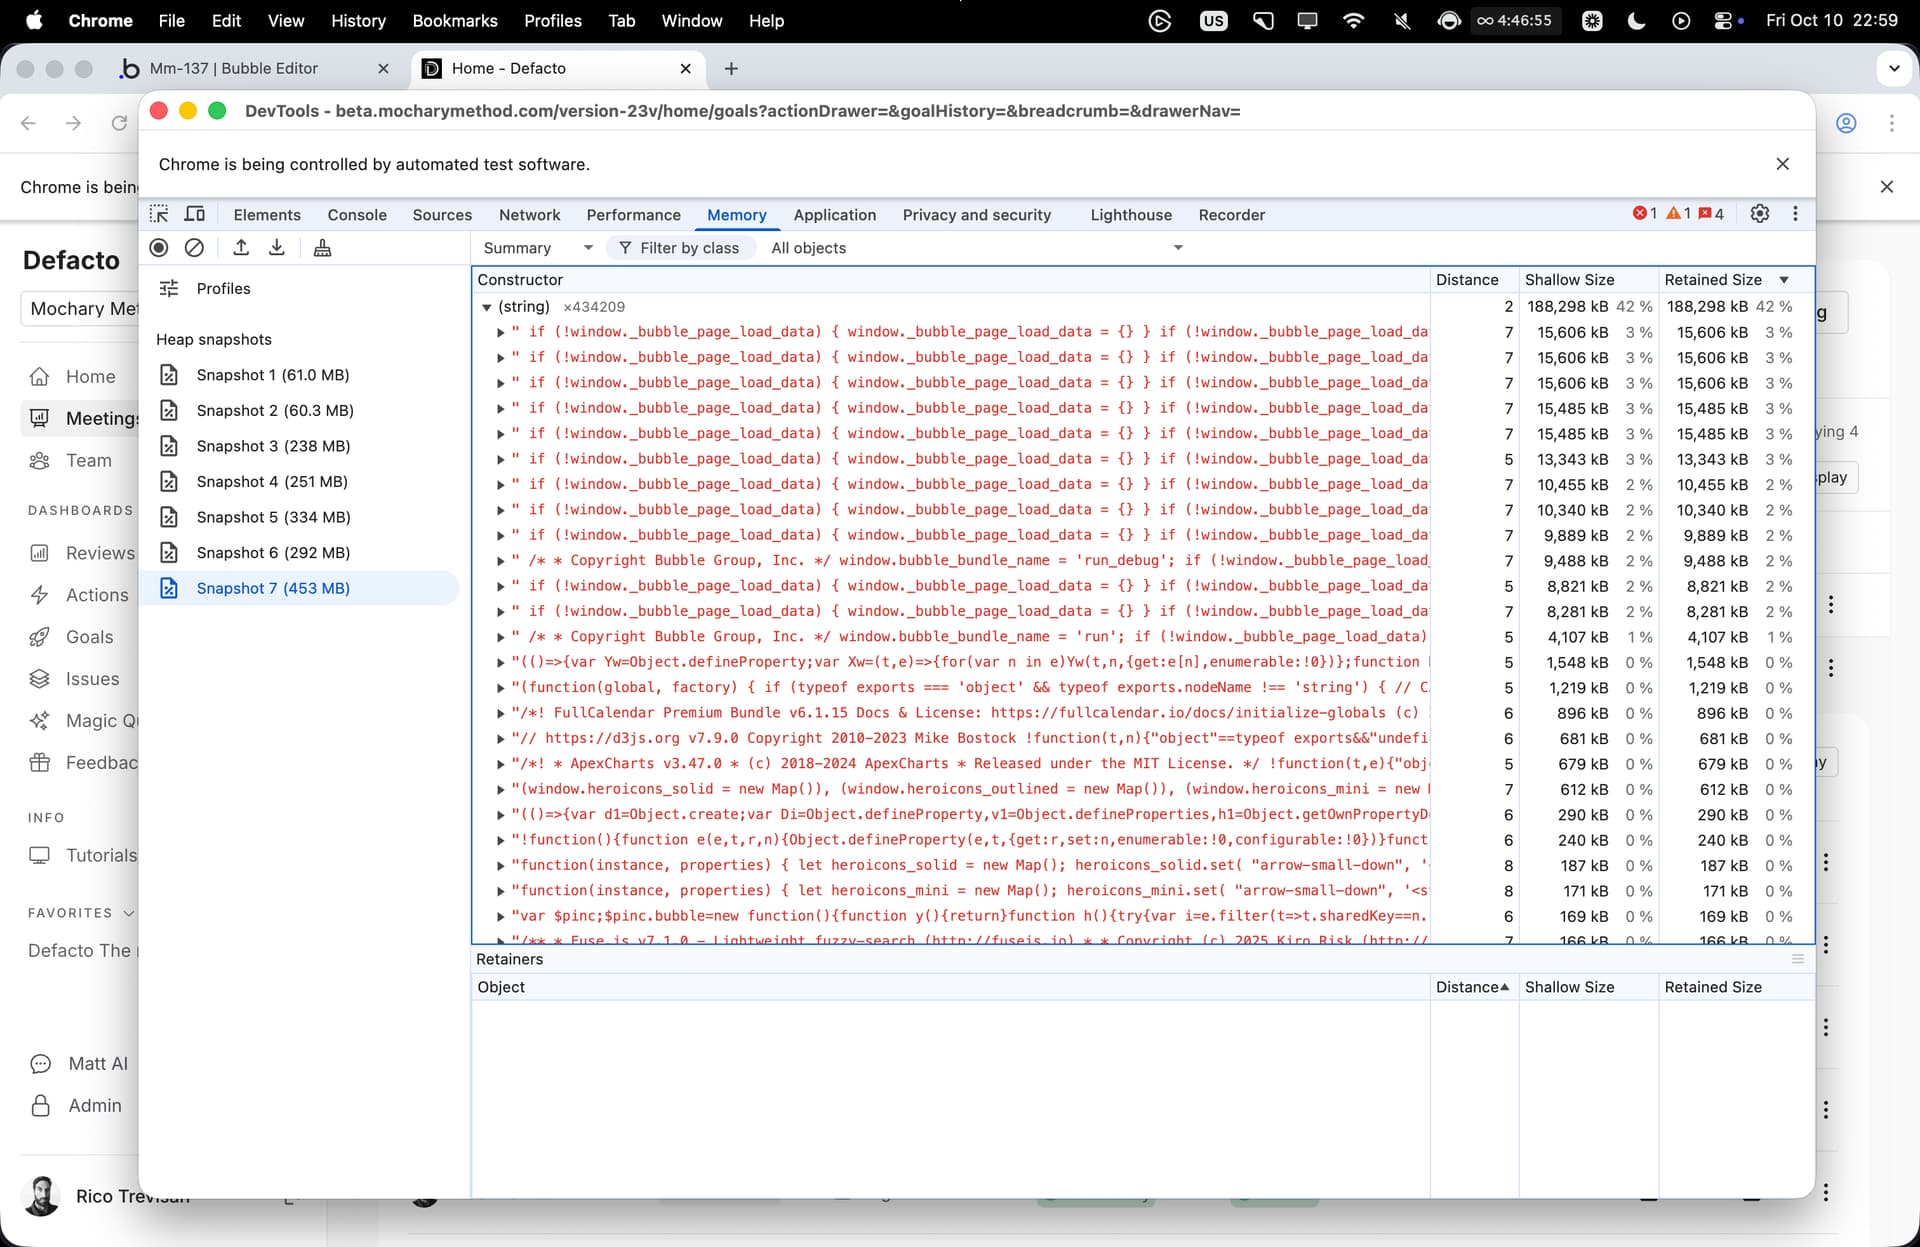
It’s a been a long night.

First step were some images that were unhinged. Added :processed with imgx where it was missing and found a 20 MB logo that I swapped for 12 KB.

Some scripts that ChatGPT gave me that helped me figure out the offenders:

  • decoded image impact
[...document.images]
  .map(img => ({
    src: img.currentSrc || img.src,
    w: img.naturalWidth, h: img.naturalHeight,
    decodedMB: (img.naturalWidth * img.naturalHeight * 4) / (1024*1024)
  }))
  .sort((a,b)=>b.decodedMB-a.decodedMB)
  .slice(0,20);
  • Sum decoded memory per unique URL
(() => {
  const rows = [...document.images].map(img => ({
    src: img.currentSrc || img.src,
    w: img.naturalWidth, h: img.naturalHeight,
    decodedMB: (img.naturalWidth * img.naturalHeight * 4) / (1024*1024)
  }));

  const bySrc = rows.reduce((m, r) => {
    const t = m.get(r.src) || {src:r.src, w:r.w, h:r.h, decodedMB:0, count:0};
    t.decodedMB = Math.max(t.decodedMB, r.decodedMB); // upper bound per resource
    t.count += 1;
    return m.set(r.src, t);
  }, new Map());

  const list = [...bySrc.values()]
    .sort((a,b)=>b.decodedMB-a.decodedMB);

  const total = list.reduce((s,r)=>s+r.decodedMB,0);
  console.table(list.slice(0,30));
  console.log("≈ Unique decoded MB (upper bound):", total.toFixed(1));
})();
  • Find waste: images way larger than they’re displayed
(() => {
  const BAD_RATIO = 2; // natural dimension > 2× display dimension
  const rows = [...document.images].map(img => {
    const r = img.getBoundingClientRect();
    const dispW = Math.max(1, Math.round(r.width  * devicePixelRatio));
    const dispH = Math.max(1, Math.round(r.height * devicePixelRatio));
    const overW = img.naturalWidth  / dispW;
    const overH = img.naturalHeight / dispH;
    return {
      src: img.currentSrc || img.src,
      natural: `${img.naturalWidth}×${img.naturalHeight}`,
      display: `${dispW}×${dispH}`,
      overW: +overW.toFixed(2),
      overH: +overH.toFixed(2),
      decodedMB: ((img.naturalWidth * img.naturalHeight * 4) / (1024*1024)).toFixed(2)
    };
  }).filter(r => r.overW > BAD_RATIO || r.overH > BAD_RATIO)
    .sort((a,b)=>b.decodedMB - a.decodedMB);

  console.table(rows.slice(0,50));
  console.log("Oversized count:", rows.length);
})();
  • Spot duplication
(() => {
  const counts = {};
  for (const img of document.images) {
    const src = img.currentSrc || img.src;
    counts[src] = (counts[src]||0) + 1;
  }
  const dupes = Object.entries(counts)
    .filter(([,c])=>c>3)
    .sort((a,b)=>b[1]-a[1]);
  console.table(dupes.map(([src,c])=>({uses:c, src})).slice(0,30));
})();
1 Like

Looks solid, so you reduced the quality of the loaded media and it fixed your problem.

How did you solve the duplication?

The running app is staying within 500 MB.
There were a couple of wild-sized logos at 1200x1200 that were probably drowning the page. :person_shrugging:

The bigger problem is that there were some user photos of 2 to 5 MB. That is normally not a problem when you pipe it via the :processed with imgx, but they were being used via their raw URLs in dropdowns. :sweat_smile:

Thanks for help. I’ve got tons of things to do still.

I need to revisit some of the plugins we built and make sure they are not creating elements that can’t be garbage-collected.

1 Like

Sure, I love helping troubleshooting random problems :sweat_smile:

For interest sake … using a photoshopped image where multiple images were stacked to create for example a poster, can cause that image size to increase significantly. One of the people in my network do branding for various kinds of businesses here in South Africa. He is rather old and still uses photoshop, he’s had images that are larger than 2 GB but it doesn’t matter for him because he basically has a super computer.

Also, one of the reasons I was particularly interested in this problem is I am building an image&video based semi-social networking platform … so I would like to avoid these issues by making sure I’m in the loop on potential bottlenecks

1 Like

Wow, this is not going away and I’m not figuring out what the hell is causing it.

I’ve got a page with nothing is consuming 100s of MB. It must be some plugin, but I just can’t put my finger on it.

Is it normal that Bubble loads itself multiple times?

First, I’m no expert on this when it comes to Bubble.

I don’t know if you’re using an SPA, but I do, and this is something I was looking into recently.

Bubble doesn’t handle SPAs like regular coding does in React, etc.

When I go to a page - current page, Bubble reloads the whole page and all the reusable groups I have that serve as pages, which is probably what you’re seeing.

This builds up memory because there’s no ‘release valve’ to empty the memory occasionally. There are ways to empty the memory occasionally, but I haven’t done any of that yet.

So, after a long back-and-forth chat with ChatGPT, it basically told me the best approach was to put conditionals on the reusables to prevent them from using data until they were called on. Whether AI is right about this, I don’t know, because again, I’m not that smart about some things Bubble.

I don’t know if any of this makes sense. I’m still in the process of figuring it all out, but that is basically the conclusion I came to as far as memory leaks for my situation.

Maybe they have somewhere, but I haven’t found where Bubble actually says what is loaded on page load with a SPA?

Anyway, this might not help…but it’s just a thought that might get you closer to what’s causing the problem

2 Likes

Thanks! I’ve been toggling plugins on and off for a couple of days now.

Updating to v4.0.8 (and then removing - because I realized I don’t really use it that much) Classify has calmed the burn down a bit. It’s certainly not the cause, but whatever is causing this issue, wa causing Classify to compound it.

This still puzzles me. This is an empty page with all the plugins and HTML turned off.


Also,
[pulls up soap box, stands on it]
Why the hell is Bubble putting so many trackers on the logged in page?!

No way in hell there’s a team digesting and making sense of all this data!

Ah, yeah, wait, my conspiracy theory is that Bubble makes more money selling your data than actually with subscriptions. That’s the only explanation.

1 Like

Yeah, looking at both images, I really don’t think it’s plugins.

If I had to put money on it, I’d say it’s exactly what I mentioned earlier, Bubble’s SPA memory stacking. Every time a new “page” gets visited, Bubble hangs onto it instead of clearing it out, and the screenshots showing multiple window contexts and bubble_page_load_data objects pretty much confirm that.

I’d bet just about any amount of money that’s what’s going on here

1 Like

Grrh!! Sh*t is just unhinged. No one else is editing the app and this is constantly happening.