I’ve had my SaaS running now for 7 months on Bubble’s Professional Plan with 3 Units of capacity.
I’m finding that the process of anyone logging in now takes over a minute or two to advance to the next screen. Initially it was super quick, but as members are growing it’s become incredibly slow and people are commenting about it a lot. I’ve got less than 100 members and so I don’t know why everything has come to a standstill.
Is anyone available to help troubleshoot this with me? We’re happy to compensate for your time.
@underhill.dan
Dan, can you please post updates here as you investigate this issue. I’m certain a lot of people will be very interested in what you are able to find out. It cuts right to the core question that many people have asked over the years. How far can one actually scale on Bubble?
I will definitely post updates as they become available. Overall I love using Bubble, and I have a few more SaaS projects in development using it so I really want to hone down the best practices to keep things zippy if I can discover them.
I can actually see that the log in portion is working quickly. It’s the next page where things are taking forever to load. I have some ideas now actually thinking about it, but I won’t be able to check it until Thursday when I’m back in my office.
SITUATION
I have a lot of RGs loading at once in this big one-page app. Each of these groups is using the Search&Autocorrect plug in for “search on the fly” type of searching. That function works great BTW. However…
PROBLEM
If I start with any of these RGs already hidden on page load, then Search&Autocorrect does not work/load. The group that uses S&A needs to be visible on page load. I think it’s a bug that S&A must be visible on page load in order for it to work. Once loaded the RGs can be hidden and revealed again and S&A works fine after that.
So what I have done currently is use workflows on Page Load that simply hide each of these many RGs while covering them with a loading screen. Once the entire page is loaded the loading screen is hidden and off we go.
In this way however ALL of my entire app’s RGs and data that use S&A load their respective data slowing the whole thing down. If I didn’t need to use S&A in all of these groups then I could just start the main page will all of these RGs hidden and therefore none of them would load their data until they are made visible later when the user needs them, if I’m not mistaken.
So if there is no fix for S&A so that it can be hidden on page load and still work, I’ll need to figure out another way to do similar searches that does not utilize that plug in, or delete that functionality so I can have all of these many RGs hidden from the start to speed up the user experience.
hi i can tell you search autocorrect plugin does not scale well at all for hundreds of things so thats not really bubbles fault.
use algolia if you want fast search. (although ideally bubbles search should be faster and not require a paid external startup worth billions to deliver)
Actually S&A works great with large amounts of data from my experience.
The real problem is that in order for S&A to work, it must be visible on page load. That means if I’m using a unique S&A for many large repeating group units, I have to keep ALL of them visible on page load (hidden with a loading spinner), THEN I can hide them after all of them have loaded. I believe that’s the slow down.
I’m going to take a closer look at Algolia. Has anyone used it in the same fashion as S&A for real time progressive searching/filtering of a RG’s data?
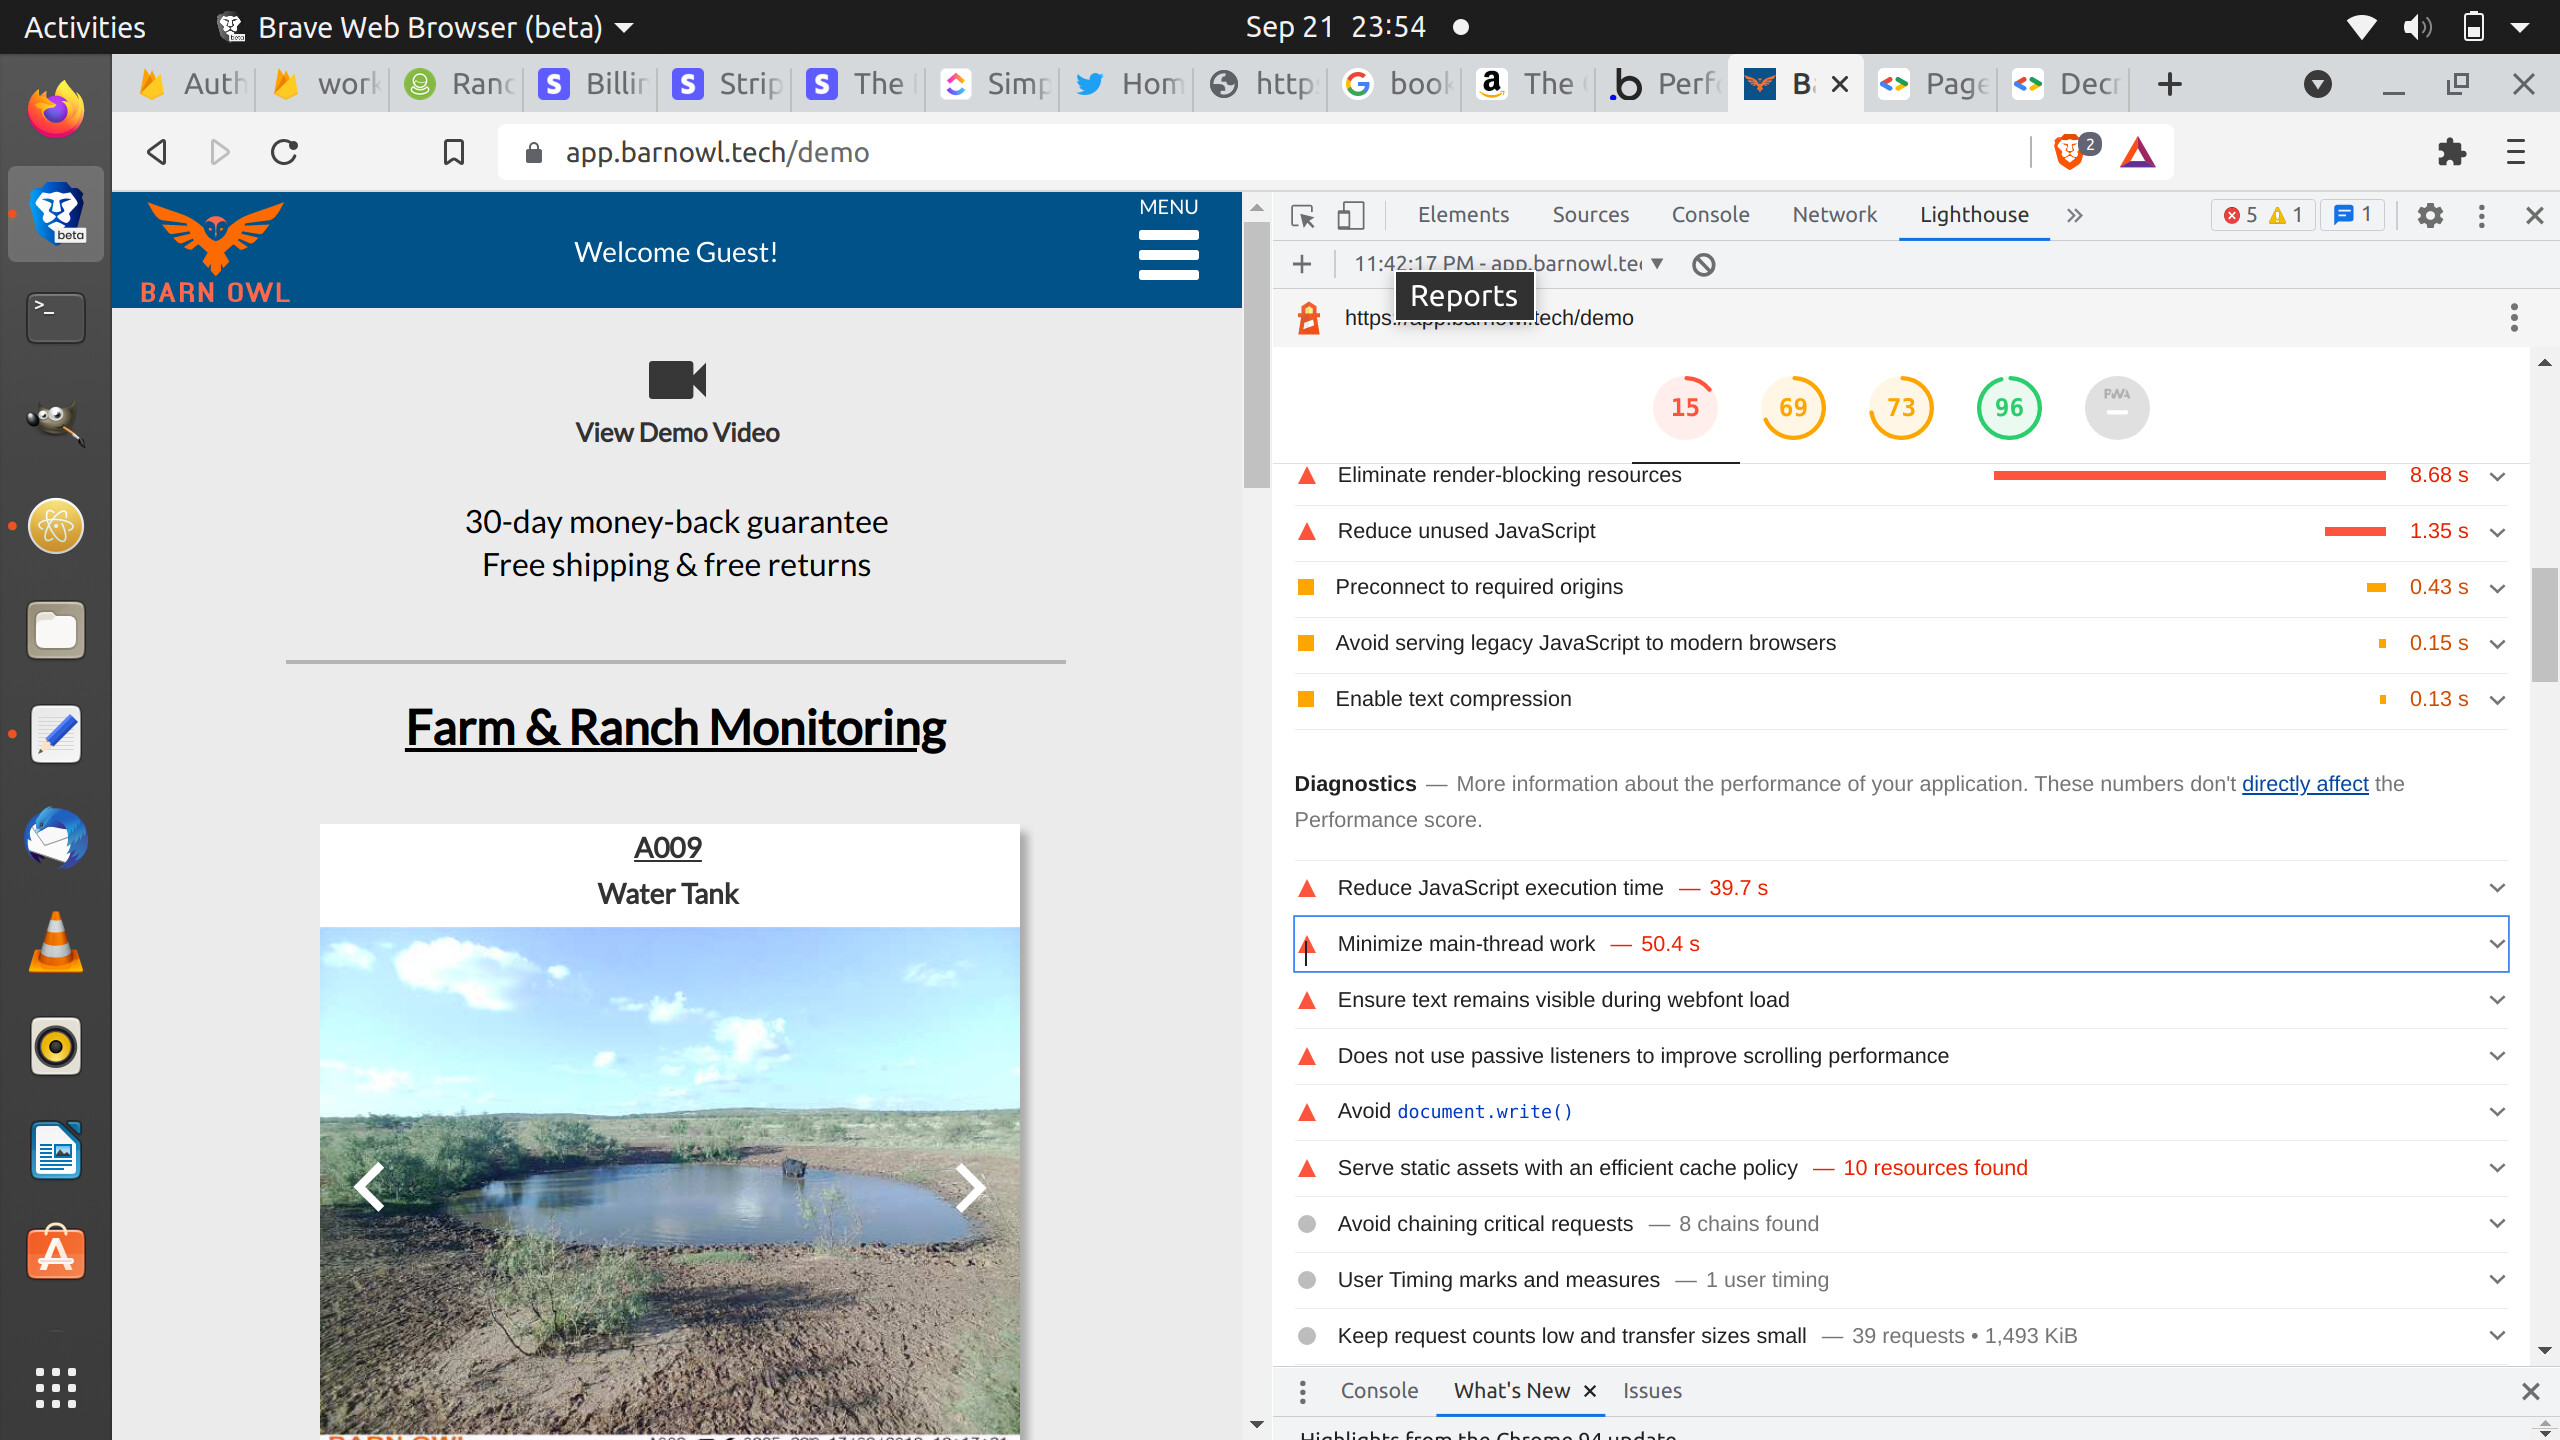
Standard devTools , performance monitoring employed for years may or may not be relevant and its not clear what degree of outside tools is relevant to debug on Bubble.io platform .
Dont want to hijack the thread , but if someone provides a public URL to one of these slow-to-load pages, then there may be devs who can drill-down on performance.
If its chronic issue, it would be nice to get some guidance/ docs from bubble on the issue.
Without seeing all your set up (database structure plus RG set ups), it’s a little hard to properly comment but how you are doing it sounds like a convoluted way.
I don’t think you need to have everything visible on page load for the S&A to work - at least that’s not my experience.
I have found a marked difference in RG performance just based on a few tweaks to how I grab the data from the database and also my database structure…and the set up of the RG itself. Initially (dev agency made MVP), the RG was agonisingly slow when real world levels of data was input by users…I had to do a bit of research on performance and was able to rework. I’m talking about 1/3rd of the time to load. So from 6-7 seconds to 2-3 seconds.
This is quite consistent with my own app on bubble as well… and these past few days I’ve gotten more reports from my users that page load speeds are unbearably slow.
Digging around for this topic on the forums show that these speed issues we’re the same even a year ago
I dont have any answers or tips as I’m still debugging my app. I’ll be going over the way my RGs pull data (I know there are currently quite a few inefficiencies) but I dont think that’s the main issue… The main bubble.io page and my home page doesn’t have data heavy RGs.
This is why I believe that the biggest culpit could be this -
There’s a lot more insights from @josh (Bubbble founder) on how bubble handles performace on that thread (albeit its a little dated), the one related to this topic could be that first time loads are always the longest. Which is why your version-test or when you load your app it can feel fast but other users tell you it’s slow. It’s also why PageSpeed insights shows slow loads.
Bookmarking this page to see how things goes for you all!
im new to bubble , but im willing to make a wild guess …
write a decent pure JS loop that does nothing more than Fetch calls on the Twitter api so that its decent ASYNC and decently optimized re the event loop and threads…
AND compare that to a Workflow implementation of the same RG of api connector calls out to the same list of Twitter api calls …
So that the results can be compared ( apples to apples ) . Based on a quick code review ( run-server function for http post action in stripe V2 plugin for “create customer” ) of a random plugin i can make a newbie observation …
line 56 of that function looks to be a blocking call ( sync ) implementation of a Fetch. Not possible to say for sure without access to all the dependencies , but it jumped out right away in the context of a quick code review.
Why not use ASYNC Fetch at line 56? That would be standard, performant use of http at the JS level ???
to swap in some data for the speculation, i may write that comparison ( looping a bunch of calls on the twitter api ) and compare the performance numbers . I only have a free-tier account but i guess that i can run in dev mode and still generate reliable comparisons for elapsed time.
Still troubleshooting this… is there a way to see what’s happening during the time a page is loading?
My log in window is straightforward. Name/Password? User logs in and if successful is redirected to my main page of the app. That redirect happens quickly no problem.
However, before the main page loads, it sits there forever with a white screen waiting and waiting. Only when the page successfully loads do any of the elements render on the page.
I have deleted virtually everything that has to do the workflows and RGs just to see what individual workflow or element is causing this 30 second to 2 minute white page delay.
Is there a way to monitor what exactly is going on during this white page delay? I cannot access the SLOW or STEP mode until the page fully resolves.
What happens when you inspect the page and look at network, that should give you some insight in to what is loading. Can searches be optimised to perform server side?
Click on step by step in the debugger just before you hit your login button - this will show what is happening as it navigates to the new page. There’s might be a few ‘on page load’ workflows happening.
Do you also have any conditionals on your main elements to not show until something is fully loaded? Element conditionals won’t show up in the debugger as they aren’t workflows.
Are you using any plugins on this page? Or have any plugins installed but not used on the page that have ‘this service adds an HTML header to your pages’? Some plugins can really mess with speed performance.
I’ve tried that, but the tricky thing is that the RUN readout at the bottom of the browser disappears when the page switches to white and pauses there for a minute so I can’t see anything anyway.
In Chrome, you can try looking at the waterfall chart in the Network tab. I’m not that familiar with it’s use, but it’s supposed to show you everything being loaded and the time it takes.
Also…
If I were in your shoes I would duplicate the page and delete all the data calls in the RGs or workflows that require data being loaded or manipulated. Then if the page loads fine, I’d start to rebuild the data calls one by one to see what’s causing the issue.
Also 3rd party plugins throw in an extra wildcard; I’m not familiar with the one you are using, but recall seeing similar instances where the issue was the plugin. So I would strip it from the page then reintroduce to see the performance impact it has.
I had a similar issue on loading pages previously. Even for much fewer users, what I found was that when I fetched data, it was actually much more data than a human would ever be needing.
So after I limited the amount of data I fetched, the searching got faster and loading speed increased.
It sound like when you sign into the application, you got a lot of data that need to be fetched instantly. I would consider redesigning it in away to limit the data needed right after signing in.
You can do some split testing with the users to see if they complain about slightly fewer data points shown at load.
After tremendous amounts of trial and error, I isolated the problem to the Wasabi plug in that I use, which provides core functionality of my app. They had made some updates recently which, for some reason, introduced a 1 minute lag between the transition of my Login page, and the main page of my app. Once upgrading it and making a few tweaks to some new fields they introduced, my load speed went from 1.2 minutes back down to about 3-4 seconds.